Table of Contents
Overview
In cases where data quality is not sufficient for dedicated pharmacokinetic analysis, or if global scouting of the overall image is performed to identify regions of interest, it is often advisable to use semi-quantitative measures that describe the general shape and type of the curve. The Perfusion Curve Description Parameters View can be used to voxelwise calculate these parameters.
Currently the following parameters are offered by the tool (visualized in figure 1):
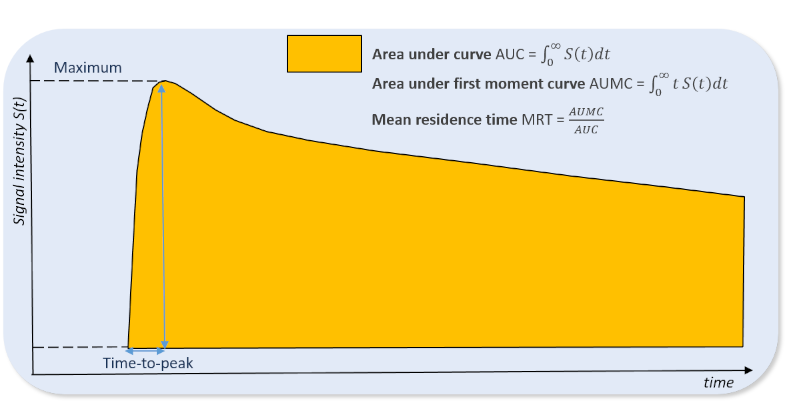
- area-under-the-curve (AUC): The absolute area under the signal time curve is calculated by step-wise integration with linear interpolation between sampling points.
- area-under the first moment curve (AUMC): The absolute area under the first moment signal time curve is calculated by step-wise integration with linear interpolation between sampling points.
- mean-residence-time (MRT): The mean residence time is calculated as MRT = AUMC/AUC.
- time-to-peak: The duration between the onset time and the time of the maximum signal of the curve.
- maximum signal: The overall maximum of all data points of the curve.
These parameters are usually calculated directly from the raw data signal intensities of the acquired MR image. Alternatively, if semi-quantitative parameters should be calculated from concentration time curves, use the The DCE Concentration Curve Converter View prior to the parameter calculation. Parameters of interest can be selected from the list. Selecting a 4D image enables the Calculate Parameters button. Resulting parameter maps will afterwards be added to the data manager as subnodes to the analyzed 4D image.