Table of Contents
Overview
This view offers a dedicated tool for the conversion of DCE MR image signal intensities to contrast agent (CA) concentration. It contains a subset of the conversion tools for T1-weighted signal intensities, which are also a part of the DCE MR Perfusion Datafit View. Additionally, it allows for the conversion between T2-weighted MR signal intensities and contrast agent concentration.
Contact information
If you have any questions, need support, find a bug or have a feature request, feel free to contact us at www.mitk.org.
Conversion of T1-weighted MRI data
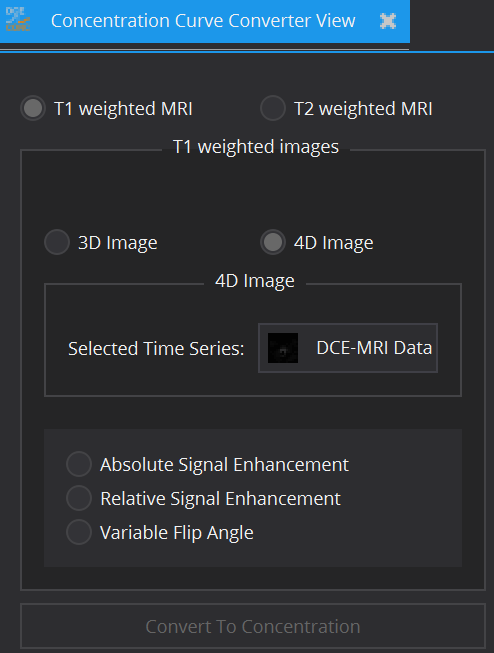
The view offers the choice between a 3D Image and a 4D image. If a 4D image is selected, the Selected Time Series needs to be specified. For 4D images, for all conversion methods which require a baseline value, the range of the time points which are part of the baseline can be specified. The baseline signal SBL will be averaged between the signal of the time points within this range. If not specified, the baseline signal SBL is set as the signal of the first time point image of the time series. In case of a 3D image to be converted, additionally to the selected 3D image a Baseline Image (without CA) has to be specified.
The following types of conversion can be chosen:
- Absolute Signal Enhancement: The dynamic contrast agent concentration C(t) is calculated according to the formula: C(t) = k*(S(t)-SBL), where S(t) is the dynamic T1-weighted signal intensity, SBL the baseline signal and k a user-defined conversion factor.
- Relative Signal Enhancement: The dynamic contrast agent concentration C(t) is calculated according to the formula: C(t) = k*(S(t)-SBL)/SBL, where S(t) is the dynamic T1-weighted signal intensity, SBL the baseline signal and k a user-defined conversion factor.
- Variable Flip Angle: This conversion uses the method described in [1]. As additional input to the dynamic time series, a proton density weighted (PDW) image is provided, which has been acquired pre-contrast with the same sequence parameters as for the dynamic image but a smaller flip angle. Both flip angles are provided by the user. Furthermore, the repetition time TR and the longitudinal relaxivity r1 are required as input.
It is assumed that the MR data has been acquired according to the spoiled gradient recalled echo model. The sequence formulas for the PDW image signal and for the baseline signal of the dynamic time series are two equations with two unknowns: the pre-contrast R1-relaxation rate R10 and the signal scaling factor S0. These are calculated by solving the system of equations.
With the knowledge of S0, the dynamic contrast-enhanced relaxation rate R1(t) is computed. Finally, the concentration is calculated by inverting the linear model: R1(t)=R10+r1*C(t).
Conversion of T2-weighted MRI data
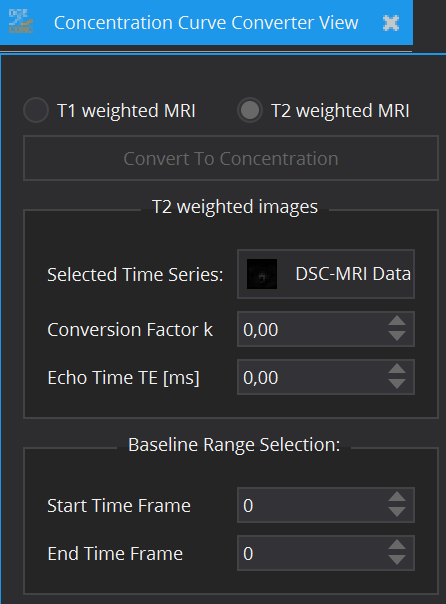
The dynamic contrast agent concentration C(t) is calculated according to the formula: C(t) = -k/TE*ln(S(t)/SBL), where S(t) is the dynamic T2-weighted signal intensity, SBL the baseline signal, k a user-defined conversion factor and TE the echo time of the employed sequence. In practice, the factor k is often set to unity.