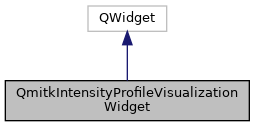
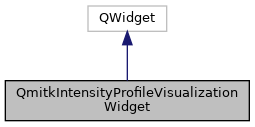
Widget for displaying intensity profile line charts along a path. More...
#include <QmitkIntensityProfileVisualizationWidget.h>
Public Member Functions | |
| QmitkIntensityProfileVisualizationWidget (QWidget *parent=nullptr) | |
| Constructs the intensity profile visualization widget. More... | |
| ~QmitkIntensityProfileVisualizationWidget () override | |
| Destructor. More... | |
| void | SetIntensityProfile (mitk::IntensityProfile::ConstPointer intensityProfile, const std::string &dataLabel) |
| Displays an intensity profile as a line chart. More... | |
| void | Reset () |
| Clears the chart and disables all GUI elements. More... | |
| void | SetTheme (QmitkChartWidget::ColorTheme style) |
| Sets the color theme for the chart widget. More... | |
Detailed Description
Widget for displaying intensity profile line charts along a path.
Provides a chart-based visualization of intensity values along a line or path, with controls for toggling a subchart overview and copying the intensity data to the clipboard. The chart displays distance on the X-axis and intensity values on the Y-axis.
Definition at line 42 of file QmitkIntensityProfileVisualizationWidget.h.
Constructor & Destructor Documentation
◆ QmitkIntensityProfileVisualizationWidget()
| QmitkIntensityProfileVisualizationWidget::QmitkIntensityProfileVisualizationWidget | ( | QWidget * | parent = nullptr | ) |
Constructs the intensity profile visualization widget.
- Parameters
-
[in] parent Optional parent widget.
◆ ~QmitkIntensityProfileVisualizationWidget()
|
override |
Destructor.
Member Function Documentation
◆ Reset()
| void QmitkIntensityProfileVisualizationWidget::Reset | ( | ) |
Clears the chart and disables all GUI elements.
◆ SetIntensityProfile()
| void QmitkIntensityProfileVisualizationWidget::SetIntensityProfile | ( | mitk::IntensityProfile::ConstPointer | intensityProfile, |
| const std::string & | dataLabel | ||
| ) |
Displays an intensity profile as a line chart.
Converts the intensity profile to a vector of values and adds it to the chart widget. If the profile is nullptr or empty, the call is ignored.
- Parameters
-
[in] intensityProfile The intensity profile to visualize. May be nullptr. [in] dataLabel A label identifying this data series in the chart.
◆ SetTheme()
| void QmitkIntensityProfileVisualizationWidget::SetTheme | ( | QmitkChartWidget::ColorTheme | style | ) |
Sets the color theme for the chart widget.
The theme is applied when the chart page finishes loading.
- Parameters
-
[in] style The color theme to apply (dark or light).
The documentation for this class was generated from the following file: