QmitkPlotDialog Class Reference
#include <QmitkPlotDialog.h>
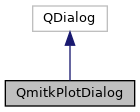
Inheritance diagram for QmitkPlotDialog:

Collaboration diagram for QmitkPlotDialog:

Public Member Functions | |
| QmitkPlotDialog (const char *title, QWidget *parent=nullptr, const char *name=nullptr) | |
| ~QmitkPlotDialog () override | |
| QmitkPlotWidget * | GetPlot () |
| QwtPlot * | GetQwtPlot () |
Protected Attributes | |
| QmitkPlotWidget * | m_Plot |
| QPushButton * | m_CloseDialogButton |
Detailed Description
Provides a GUI interface for plotting curves using QmitkPlotWidget. Designed for qwt version 5.1.1. To plot data do the following:
- Create two QmitkPlotDialog::DataVector Objects and fill them with corresponding x/y values. DataVectors are simple stl-vectors of type std::vector<double>. Please note that the xValues vector and the yValues vector MUST have the same size.
- Instantiate and show the dialog for example like that: QmitkPlotDialog* dlg = new QmitkPlotDialog( "My dialog title", this, "dlg" ); dlg->GetPlot()->SetAxisTitle( QwtPlot::xBottom, "My x asis [mm]" ); dlg->GetPlot()->SetAxisTitle( QwtPlot::yLeft, "My y axis [mm]" ); int curveId = dlg->GetPlot()->InsertCurve( "My sophisticated data" ); dlg->GetPlot()->SetCurveData( curveId, xValues, yValues ); dlg->GetPlot()->SetCurvePen( curveId, QPen( red ) ); dlg->GetPlot()->SetCurveTitle( curveId, "My curve description" ); dlg->GetPlot()->Replot(); dlg->exec();
- You can modify the behavior of the plot by directly referencing the QwtPlot instance using the method GetQwtPlot().
- See also
- QwtPlot,
- QmitkPlotWidget
Definition at line 43 of file QmitkPlotDialog.h.
Constructor & Destructor Documentation
◆ QmitkPlotDialog()
| QmitkPlotDialog::QmitkPlotDialog | ( | const char * | title, |
| QWidget * | parent = nullptr, |
||
| const char * | name = nullptr |
||
| ) |
Standard qt constructor
◆ ~QmitkPlotDialog()
|
override |
Virtual destructor
Member Function Documentation
◆ GetPlot()
| QmitkPlotWidget* QmitkPlotDialog::GetPlot | ( | ) |
Returns the instance of the QmitkPlotWidget. This may be used to modify any detail of the appearance of the plot.
◆ GetQwtPlot()
| QwtPlot* QmitkPlotDialog::GetQwtPlot | ( | ) |
Returns the instance of the plot-widget. This may be used to modify any detail of the appearance of the plot.
Member Data Documentation
◆ m_CloseDialogButton
|
protected |
Definition at line 71 of file QmitkPlotDialog.h.
◆ m_Plot
|
protected |
Definition at line 69 of file QmitkPlotDialog.h.
The documentation for this class was generated from the following file:
