Medical Imaging Interaction Toolkit  2016.11.0
Medical Imaging Interaction Toolkit
The Connectomics Statistics View
QmitkConnectomicsStatisticsViewIcon_48.png
Icon of the Connectomics Statistics View

This view can be used to show statistical analysis of a network.

statisticsview.png
The user interface

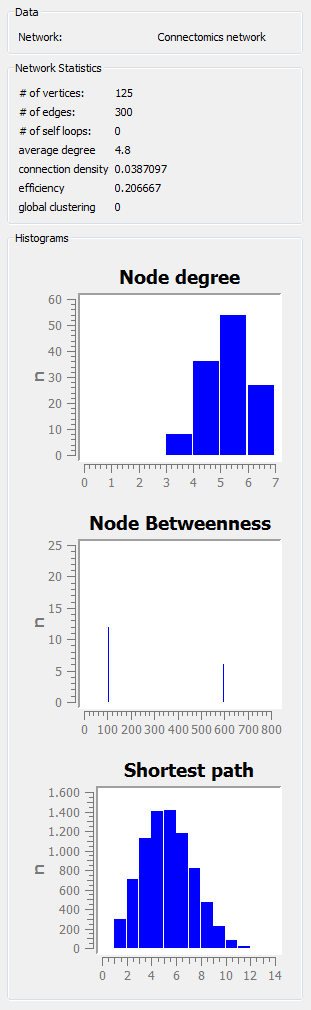
To calculate network statistics select a network in the datamanager. At this time the following statistics are calculated for the entire network:

  • The number of vertices in the network
  • The number of edges in the network
  • The number of edges which have the same vertex as beginning and end point
  • The average degree of the nodes in the network
  • The connection density the network (the number of edges divided by the number of possible edges)
  • The unweighted efficiency of the network ( 1 divided by average path length, this is zero for disconnected graphs)
  • The global clustering

Furthermore some statistics are calculated on a per node basis and displayed as histograms:

  • The degree of each node
  • The (unweighted) betweenness centrality of each node
  • The spread of shortest paths between each pair of nodes (For disconnected graphs the shortest paths with infinite length are omitted for readability)