Summary
This view provides an easy interface to quickly compute some features of a whole image or a region of interest.
This document will tell you how to use this view, but it is assumed that you already know how to use MITK in general.
Please see Details for more detailed information on usage and supported filters.
Details
Manual sections:
Overview
This view provides an easy interface to quickly compute some features of a whole image or a region of interest.
Usage
To select the input data, either use the quick selection button (labeled "+"), or select the input data via the "Input Data" tab.

Statistics
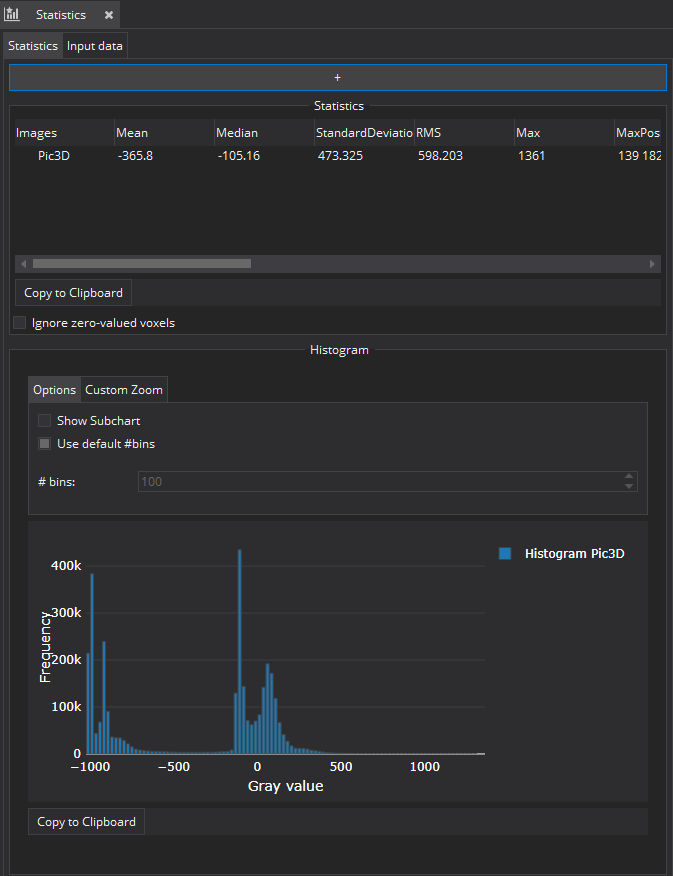
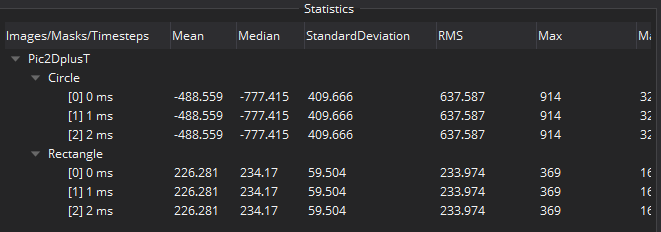
After selection of an image or a binary mask as input data, the image statistics are calculated and displayed in the "Statistics" section. If masks (ROIs: segmentations, planarfigures, ...) are selected, the statistics for these masks are shown. For time data the statistics for each time step are calculated correspondingly.
An example of parts of the calculated statistical features (Mean, Median, StandardDeviation, RMS, Max, MaxPosition, Min, MinPosition, Voxel, Volume [mm^3], Skewness, Kurtosis, Uniformity, Entropy, MPP, UPP and Variance) for different timesteps and different masks is pictured below.
Check "Ignore zero-valued voxels" to hide voxels with grayvalue zero.
Histogram
Beneath the statistics window is the histogram window, which shows the histogram of the current selection.
The histogram window is currently only available for a single image and no or one ROI: When selection multiple images and/or multiple masks, the histogram window is deactivated!
Draw a rectangular window with a pressed left button to zoom in on the histogram. With a double click in the view area you can zoom out to the default viewport. You can also pan the view in horizontal or vertical direction by dragging with the left mouse button in the respective direction. Additionally, different options like "Custom Zoom", to set the maximum and minimum value, or by adjusting the number of bins, can be used to modify the view.
If the mask is not a closed planar figure or a segmentation an intensity profile is created instead of the histogram.
A tooltip is available by hovering over one of the bins.
Copy to Clipboard
At the bottom of each view is a "Copy to Clipboard" button, allowing to copy the respective data in csv format to the clipboard. Be aware of the following information regarding this functionality:
- The values are separated by tabulator.
- Numeric values will be converted using the system language (e.g. with German as system language the decimal separator will be ",", with English it will be '.').
- One can directly copy'n'paste into Excel (and alike) as long as Excel supports/is configured to the system language