Table of Contents
Introduction
The Model Fit Inspector (MFI) View offers the possibility to display the time course of the signal within an individual voxel (with or without fit).
Viewing without a model fit
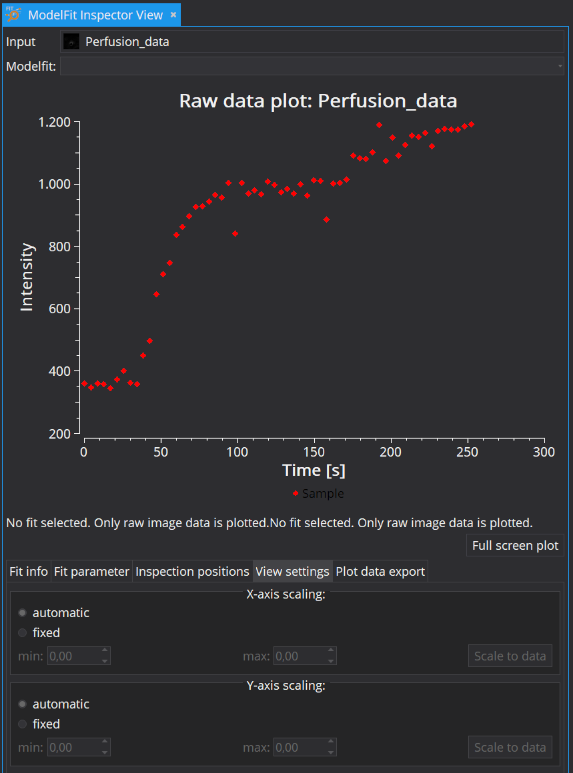
Open the view and choose the dynamic image via the Input selection widget from the available data selection in the data manager. The graph plot will show the time course of image intensities (signal) in the selected voxel (cross hair) as red data points.
Viewing with a model fit
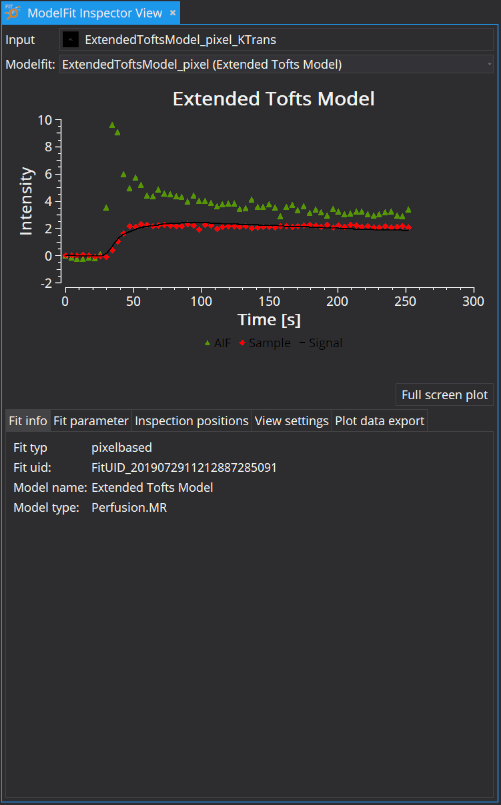
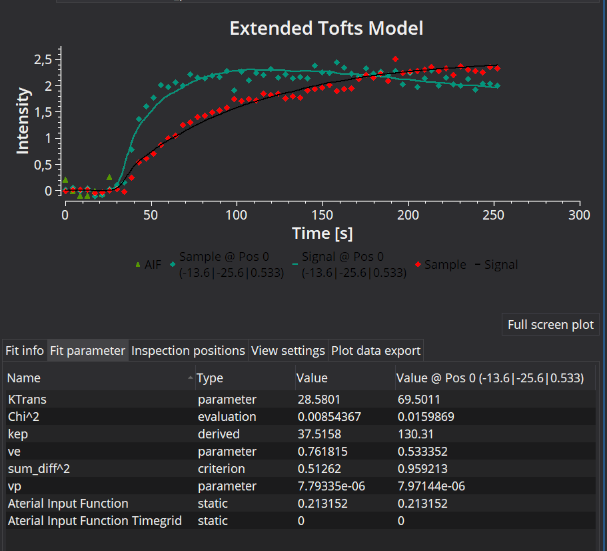
Selecting a parameter map of interest using the Input selection widget from the data selection available in the data manager will display the raw data curve as red data points along with the corresponding fit as black line in the selected cross-hair position. If an AIF-based model was used, the utilized AIF (averaged over AIF mask) is also displayed (default in green). The color of the AIF display can be adjusted (Settings tab). For ROI based fits, the MFI will display both the current data curve in the selected voxel (in red) and the ROI-averaged fitted curve (in dark green, color can be adjusted). Scrolling through the individual voxels will change the current data curve, but the ROI-based curve and the fit remain the same. If voxels outside the fitting mask are selected, the raw data voxel values will be displayed, however no black fit line is visualized.
Below the data plot, several options for data visualization can be selected:
Fit info tab
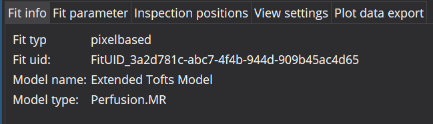
The Fit info tab displays meta-data for selected fits performed on the displayed data set. If no fit was performed and only raw data is visualized, these fields are empty.
Fit parameter tab
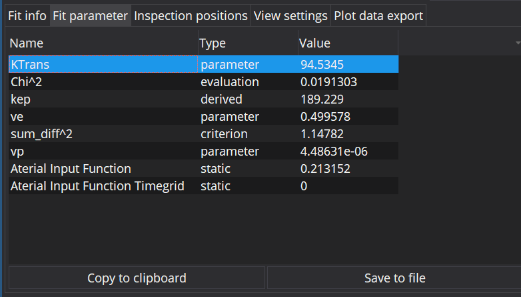
The Fit parameter tab shows fit related parameter estimates, derived parameters, fit criterion values and (optional) debug parameter maps in the selected voxel (and all inspection positions; see also inspection positions) listed as a table. If no fit was performed and only raw data is visualized, the table is empty. The content of the table may be copied to the clipboard or exported as csv file, by clicking the respective button below the table.
Inspection positions tab
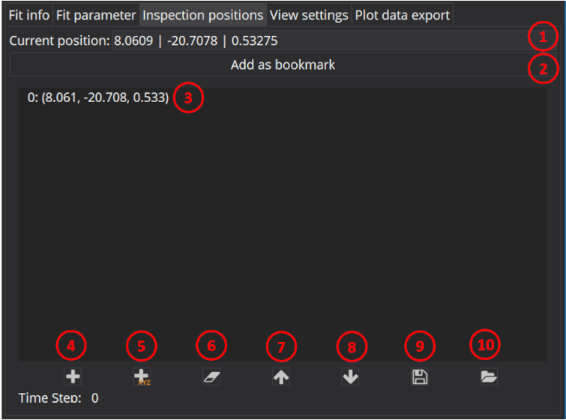
The Inspection position tab allows to manage inspection positions (see here for more about inspection positions).
- (1) Shows the coordinates of the current selected position in the workbench.
- (2) Click the Add as bookmark button to make the current position an inspected position. It will be added to the bottom of the list (3).
- (3) List of all inspection positions
- (4) Toggle adding mode on/off. If on, you can add new positions by clicking into render windows with "SHIFT + left mouse button".
- (5) Manually adding inspection positions by entering the coordinates.
- (6) Remove the selected inspection positions. (Hot key: Del)
- (7) Move the selected inspection position up in the list (3).
- (8) Move the selected inspection position down in the list (3).
- (9) Save inspection points to a file.
- (10) Load inspection points from a file.
Settings tab
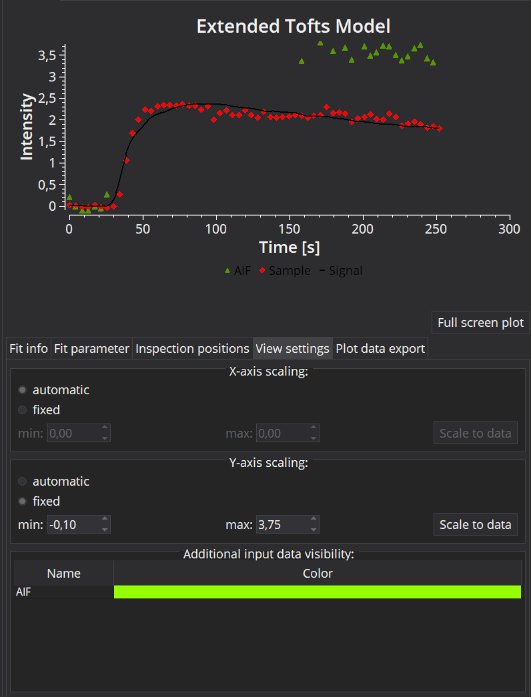
The View settings tab is used to adjust the plot display, namely, x and y axis scaling and colors of displayed data plots (i.e. AIF).
Plot data export tab
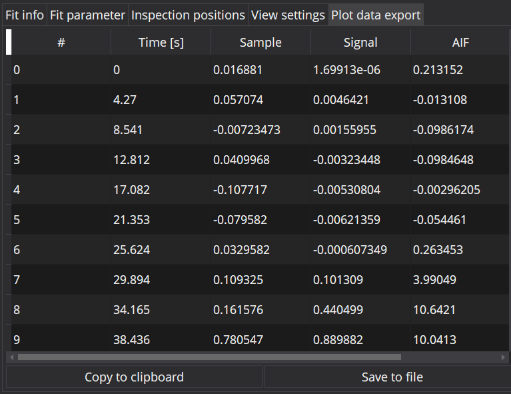
The Plot data export displays voxel data (Sample) and corresponding time grid (Time [s]) together with model fit values (Signal) and additional curves (like AIF values) for each time point. The table will contain the values of the current selected position as well as of all inspection positions (see also inspection positions). The data in the table can also be copied to clipboard or exported to csv files, by clicking the respective button below the table.
Inspection positions
The fit inspector allows to define positions in the world coordinate system that will be constantly displayed in addition to the current selected position. These inspected position will be shown in the following parts of the view:
- The plot window. See example image above; the plot shows the current position (raw data: red dots, fit: black line) and an additional inspection position (turquoise).
- The Fit parameter tab (see example image above).
- The plot data export tab.
It will work with dynamic data with and without an model fit. See the inspection positions tab section for more details on how to manage inspection positions.