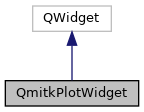
Convenience widget providing a high-level interface for plotting curves using Qwt. More...
#include <QmitkPlotWidget.h>

Public Types | |
| typedef double | ScalarType |
| Scalar type used for data values (double, defined by Qwt). More... | |
| typedef std::vector< ScalarType > | DataVector |
| Vector of scalar values representing x or y coordinates. More... | |
| typedef std::vector< std::pair< double, double > > | XYDataVector |
| Vector of (x, y) pairs representing curve data points. More... | |
Public Member Functions | |
| QmitkPlotWidget (QWidget *parent=nullptr, const char *title=nullptr, const char *name=nullptr, Qt::WindowFlags f={}) | |
| Construct the plot widget. More... | |
| ~QmitkPlotWidget () override | |
| Destructor. Clears all curves and deletes the plot. More... | |
| QwtPlot * | GetPlot () |
| Get the underlying QwtPlot instance for low-level customization. More... | |
| void | SetPlotTitle (const QwtText &qwt_title) |
| Set the plot title using a formatted QwtText. More... | |
| void | SetPlotTitle (const char *title) |
| Set the plot title using plain text. More... | |
| unsigned int | InsertCurve (const char *title, QColor color=QColor(Qt::black)) |
| Insert a new curve into the plot. More... | |
| void | SetAxisTitle (int axis, const char *title) |
| Set the title of an axis. More... | |
| bool | SetCurveData (unsigned int curveId, const DataVector &xValues, const DataVector &yValues) |
| Set curve data from separate x and y vectors. More... | |
| bool | SetCurveData (unsigned int curveId, const DataVector &xValues, const DataVector &yValues, const DataVector &yLowerError, const DataVector &yUpperError) |
| Set curve data with y-axis error bars. More... | |
| bool | SetCurveData (unsigned int curveId, const DataVector &xValues, const DataVector &yValues, const DataVector &xLowerError, const DataVector &xUpperError, const DataVector &yLowerError, const DataVector &yUpperError) |
| Set curve data with both x and y error bars. More... | |
| bool | SetCurveData (unsigned int curveId, const XYDataVector &data) |
| Set curve data from a vector of (x, y) pairs. More... | |
| void | SetCurvePen (unsigned int curveId, const QPen &pen) |
| Set the pen (line style) for a curve. More... | |
| void | SetCurveBrush (unsigned int curveId, const QBrush &brush) |
| Set the brush (fill pattern) for a curve. More... | |
| void | SetCurveStyle (unsigned int curveId, const QwtPlotCurve::CurveStyle style) |
| Set the curve drawing style (lines, sticks, dots, etc.). More... | |
| void | SetCurveSymbol (unsigned int curveId, QwtSymbol *symbol) |
| Set the symbol used for drawing data points. More... | |
| void | SetCurveAntialiasingOn (unsigned int curveId) |
| Enable antialiasing for a curve. More... | |
| void | SetCurveAntialiasingOff (unsigned int curveId) |
| Disable antialiasing for a curve. More... | |
| void | SetCurveTitle (unsigned int curveId, const char *title) |
| Set the title of a curve (shown in the plot title, not legend). More... | |
| void | SetErrorPen (unsigned int curveId, const QPen &pen) |
| Set the pen for drawing error bars. More... | |
| void | SetErrorStyleSymbols (unsigned int curveId, bool drawSmybols) |
| Set error bar drawing style. More... | |
| void | SetLegend (QwtLegend *legend, QwtPlot::LegendPosition pos=QwtPlot::RightLegend, double ratio=-1) |
| Set the plot legend. More... | |
| void | SetLegendAttribute (unsigned int curveId, const QwtPlotCurve::LegendAttribute &attribute) |
| Set a legend attribute for a curve. More... | |
| void | Replot () |
| Trigger a replot. Call after setting new data or changing appearance. More... | |
| void | Clear () |
| Clear all curves and reset the plot to an empty state. More... | |
Protected Member Functions | |
| double * | ConvertToRawArray (const DataVector &values) |
| double * | ConvertToRawArray (const XYDataVector &values, unsigned int component) |
| bool | AddErrorIntervalCurve (unsigned int curveId, const DataVector &lessError, const DataVector &moreError, bool isXError) |
Protected Attributes | |
| QwtPlot * | m_Plot |
| std::vector< std::tuple< QwtPlotCurve *, QwtPlotIntervalCurve *, QwtPlotIntervalCurve * > > | m_PlotCurveVector |
Detailed Description
Convenience widget providing a high-level interface for plotting curves using Qwt.
Wraps a QwtPlot and provides methods for inserting curves, setting data, configuring appearance (pen, brush, symbols), and managing error bars. Can be used standalone or inside a QmitkPlotDialog.
Usage example:
- Note
- QmitkChartWidget is the preferred alternative for new code.
- See also
- QmitkPlotDialog, QwtPlot, QmitkChartWidget
Definition at line 50 of file QmitkPlotWidget.h.
Member Typedef Documentation
◆ DataVector
| typedef std::vector<ScalarType> QmitkPlotWidget::DataVector |
Vector of scalar values representing x or y coordinates.
Definition at line 61 of file QmitkPlotWidget.h.
◆ ScalarType
| typedef double QmitkPlotWidget::ScalarType |
Scalar type used for data values (double, defined by Qwt).
Definition at line 58 of file QmitkPlotWidget.h.
◆ XYDataVector
| typedef std::vector<std::pair<double, double> > QmitkPlotWidget::XYDataVector |
Vector of (x, y) pairs representing curve data points.
Definition at line 64 of file QmitkPlotWidget.h.
Constructor & Destructor Documentation
◆ QmitkPlotWidget()
| QmitkPlotWidget::QmitkPlotWidget | ( | QWidget * | parent = nullptr, |
| const char * | title = nullptr, |
||
| const char * | name = nullptr, |
||
| Qt::WindowFlags | f = {} |
||
| ) |
Construct the plot widget.
- Parameters
-
[in] parent The parent widget. [in] title The plot title. [in] name The object name (unused, kept for compatibility). [in] f Window flags.
◆ ~QmitkPlotWidget()
|
override |
Destructor. Clears all curves and deletes the plot.
Member Function Documentation
◆ AddErrorIntervalCurve()
|
protected |
Adds an error interval curve.
All errors should be absolutes. The magnitude will be used.
- Parameters
-
curveId Which curve should the error curve be added to lessError Error in the negative direction (value - lessError) moreError Error in the positive direction (value + lessError) isXError Should the error bars be drawn horizontally
◆ Clear()
| void QmitkPlotWidget::Clear | ( | ) |
Clear all curves and reset the plot to an empty state.
◆ ConvertToRawArray() [1/2]
|
protected |
Converts the given values into a raw double* array. A new array is allocated via new and must be deleted[] by the caller.
◆ ConvertToRawArray() [2/2]
|
protected |
Converts the given values into a raw double* array. A new array is allocated via new and must be deleted[] by the caller.
- Parameters
-
values the x/y values to convert to an array component defines if the x values (0) or the y values(1) should be converted. Other values than 0 and 1 will not be accepted.
◆ GetPlot()
| QwtPlot* QmitkPlotWidget::GetPlot | ( | ) |
Get the underlying QwtPlot instance for low-level customization.
- Returns
- Pointer to the QwtPlot.
◆ InsertCurve()
| unsigned int QmitkPlotWidget::InsertCurve | ( | const char * | title, |
| QColor | color = QColor(Qt::black) |
||
| ) |
Insert a new curve into the plot.
- Parameters
-
[in] title The curve name (shown in legend). [in] color The curve title text color (default black).
- Returns
- The curve ID used to reference this curve in subsequent calls.
◆ Replot()
| void QmitkPlotWidget::Replot | ( | ) |
Trigger a replot. Call after setting new data or changing appearance.
◆ SetAxisTitle()
| void QmitkPlotWidget::SetAxisTitle | ( | int | axis, |
| const char * | title | ||
| ) |
Set the title of an axis.
- Parameters
-
[in] axis The axis identifier (e.g. QwtPlot::xBottom, QwtPlot::yLeft). [in] title The axis title.
◆ SetCurveAntialiasingOff()
| void QmitkPlotWidget::SetCurveAntialiasingOff | ( | unsigned int | curveId | ) |
Disable antialiasing for a curve.
- Parameters
-
[in] curveId The curve ID.
◆ SetCurveAntialiasingOn()
| void QmitkPlotWidget::SetCurveAntialiasingOn | ( | unsigned int | curveId | ) |
Enable antialiasing for a curve.
- Parameters
-
[in] curveId The curve ID.
◆ SetCurveBrush()
| void QmitkPlotWidget::SetCurveBrush | ( | unsigned int | curveId, |
| const QBrush & | brush | ||
| ) |
Set the brush (fill pattern) for a curve.
When set, the area between the curve and the baseline is filled. Curve data should be sorted for correct filling.
- Parameters
-
[in] curveId The curve ID. [in] brush The QBrush defining the fill pattern.
◆ SetCurveData() [1/4]
| bool QmitkPlotWidget::SetCurveData | ( | unsigned int | curveId, |
| const DataVector & | xValues, | ||
| const DataVector & | yValues | ||
| ) |
Set curve data from separate x and y vectors.
- Parameters
-
[in] curveId The curve ID. [in] xValues The x coordinates. [in] yValues The y coordinates.
- Precondition
- xValues and yValues must have the same size.
- Returns
- True if data was set successfully.
◆ SetCurveData() [2/4]
| bool QmitkPlotWidget::SetCurveData | ( | unsigned int | curveId, |
| const DataVector & | xValues, | ||
| const DataVector & | yValues, | ||
| const DataVector & | xLowerError, | ||
| const DataVector & | xUpperError, | ||
| const DataVector & | yLowerError, | ||
| const DataVector & | yUpperError | ||
| ) |
Set curve data with both x and y error bars.
- Parameters
-
[in] curveId The curve ID. [in] xValues The x coordinates. [in] yValues The y coordinates. [in] xLowerError The magnitude of the error in the negative x direction. [in] xUpperError The magnitude of the error in the positive x direction. [in] yLowerError The magnitude of the error in the negative y direction. [in] yUpperError The magnitude of the error in the positive y direction.
- Returns
- True if data was set successfully.
◆ SetCurveData() [3/4]
| bool QmitkPlotWidget::SetCurveData | ( | unsigned int | curveId, |
| const DataVector & | xValues, | ||
| const DataVector & | yValues, | ||
| const DataVector & | yLowerError, | ||
| const DataVector & | yUpperError | ||
| ) |
Set curve data with y-axis error bars.
- Parameters
-
[in] curveId The curve ID. [in] xValues The x coordinates. [in] yValues The y coordinates. [in] yLowerError The magnitude of the error in the negative y direction. [in] yUpperError The magnitude of the error in the positive y direction.
- Returns
- True if data was set successfully.
◆ SetCurveData() [4/4]
| bool QmitkPlotWidget::SetCurveData | ( | unsigned int | curveId, |
| const XYDataVector & | data | ||
| ) |
Set curve data from a vector of (x, y) pairs.
- Parameters
-
[in] curveId The curve ID. [in] data The vector of coordinate pairs.
- Returns
- True if data was set successfully.
◆ SetCurvePen()
| void QmitkPlotWidget::SetCurvePen | ( | unsigned int | curveId, |
| const QPen & | pen | ||
| ) |
Set the pen (line style) for a curve.
- Parameters
-
[in] curveId The curve ID. [in] pen The QPen defining line color, width, and style.
◆ SetCurveStyle()
| void QmitkPlotWidget::SetCurveStyle | ( | unsigned int | curveId, |
| const QwtPlotCurve::CurveStyle | style | ||
| ) |
Set the curve drawing style (lines, sticks, dots, etc.).
- Parameters
-
[in] curveId The curve ID. [in] style The QwtPlotCurve::CurveStyle.
◆ SetCurveSymbol()
| void QmitkPlotWidget::SetCurveSymbol | ( | unsigned int | curveId, |
| QwtSymbol * | symbol | ||
| ) |
Set the symbol used for drawing data points.
- Parameters
-
[in] curveId The curve ID. [in] symbol The QwtSymbol (ownership transferred to the curve).
◆ SetCurveTitle()
| void QmitkPlotWidget::SetCurveTitle | ( | unsigned int | curveId, |
| const char * | title | ||
| ) |
Set the title of a curve (shown in the plot title, not legend).
- Parameters
-
[in] curveId The curve ID. [in] title The curve title.
◆ SetErrorPen()
| void QmitkPlotWidget::SetErrorPen | ( | unsigned int | curveId, |
| const QPen & | pen | ||
| ) |
Set the pen for drawing error bars.
- Parameters
-
[in] curveId The curve ID. [in] pen The QPen for error bars.
◆ SetErrorStyleSymbols()
| void QmitkPlotWidget::SetErrorStyleSymbols | ( | unsigned int | curveId, |
| bool | drawSmybols | ||
| ) |
Set error bar drawing style.
- Parameters
-
[in] curveId The curve ID. [in] drawSmybols True to draw error bars as symbols, false as a filled tube.
◆ SetLegend()
| void QmitkPlotWidget::SetLegend | ( | QwtLegend * | legend, |
| QwtPlot::LegendPosition | pos = QwtPlot::RightLegend, |
||
| double | ratio = -1 |
||
| ) |
Set the plot legend.
- Parameters
-
[in] legend The QwtLegend widget. [in] pos The legend position (default: right). [in] ratio The legend size ratio (-1 for automatic).
◆ SetLegendAttribute()
| void QmitkPlotWidget::SetLegendAttribute | ( | unsigned int | curveId, |
| const QwtPlotCurve::LegendAttribute & | attribute | ||
| ) |
Set a legend attribute for a curve.
- Parameters
-
[in] curveId The curve ID. [in] attribute The legend attribute to set.
◆ SetPlotTitle() [1/2]
| void QmitkPlotWidget::SetPlotTitle | ( | const char * | title | ) |
Set the plot title using plain text.
- Parameters
-
[in] title The title string.
◆ SetPlotTitle() [2/2]
| void QmitkPlotWidget::SetPlotTitle | ( | const QwtText & | qwt_title | ) |
Set the plot title using a formatted QwtText.
- Parameters
-
[in] qwt_title The formatted title.
Member Data Documentation
◆ m_Plot
|
protected |
Definition at line 283 of file QmitkPlotWidget.h.
◆ m_PlotCurveVector
|
protected |
Definition at line 284 of file QmitkPlotWidget.h.
The documentation for this class was generated from the following file: