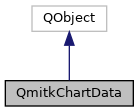
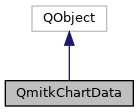
Holds global chart properties for chart generation via QWebChannel. More...
#include <QmitkChartData.h>
Public Slots | |
| void | slotImageUrl (const QString &datafromjs) |
| Slot that receives an SVG image URL from JavaScript and saves it to a file. More... | |
Signals | |
| void | SignalYAxisLabelChanged (const QVariant label) |
| Emitted when the Y axis label changes. More... | |
| void | SignalXAxisLabelChanged (const QVariant label) |
| Emitted when the X axis label changes. More... | |
| void | SignalLegendPositionChanged (const QVariant legendPosition) |
| Emitted when the legend position changes. More... | |
| void | SignalShowLegendChanged (const QVariant show) |
| Emitted when legend visibility changes. More... | |
| void | SignalShowErrorBarsChanged (const QVariant show) |
| Emitted when error bar visibility changes. More... | |
| void | SignalYAxisScaleChanged (const QVariant YAxisScale) |
| Emitted when the Y axis scale changes. More... | |
| void | SignalTitleChanged (const QVariant title) |
| Emitted when the chart title changes. More... | |
| void | SignalThemeNameChanged (const QVariant themeName) |
| Emitted when the theme changes. More... | |
| void | SignalShowSubchartChanged (const QVariant showSubchart) |
| Emitted when subchart visibility changes. More... | |
| void | SignalUsePercentageInPieChartChanged (const QVariant usePercentageInPieChart) |
| Emitted when pie chart percentage mode changes. More... | |
| void | SignalDataPointSizeChanged (const QVariant showDataPoints) |
| Emitted when data point size changes. More... | |
| void | SignalStackedDataChanged (const QVariant stackedData) |
| Emitted when stacked data mode changes. More... | |
| void | SignalMinValueXViewChanged (const QVariant minValueXView) |
| Emitted when minimum X view value changes. More... | |
| void | SignalMaxValueXViewChanged (const QVariant maxValueXView) |
| Emitted when maximum X view value changes. More... | |
| void | SignalMinValueYViewChanged (const QVariant minValueYView) |
| Emitted when minimum Y view value changes. More... | |
| void | SignalMaxValueYViewChanged (const QVariant maxValueYView) |
| Emitted when maximum Y view value changes. More... | |
| void | SignalImageUrl () |
| Emitted to request the chart image URL from JavaScript for SVG export. More... | |
Public Member Functions | |
| QmitkChartData () | |
| Construct a QmitkChartData with default property values. More... | |
| void | SetAppearance (bool showSubChart=true, bool usePercentageInPieChart=false) |
| Configure appearance-related properties in a single call. More... | |
| Q_INVOKABLE QVariant | GetXAxisLabel () const |
| Get the X axis label text. More... | |
| Q_INVOKABLE void | SetXAxisLabel (const QVariant &label) |
| Set the X axis label text. More... | |
| Q_INVOKABLE QVariant | GetYAxisLabel () const |
| Get the Y axis label text. More... | |
| Q_INVOKABLE void | SetYAxisLabel (const QVariant &label) |
| Set the Y axis label text. More... | |
| Q_INVOKABLE QVariant | GetTitle () const |
| Get the chart title. More... | |
| Q_INVOKABLE void | SetTitle (const QVariant &title) |
| Set the chart title. More... | |
| Q_INVOKABLE QVariant | GetThemeName () const |
| Get the current theme name. More... | |
| Q_INVOKABLE void | SetThemeName (const QVariant &themeName) |
| Set the chart theme name. More... | |
| Q_INVOKABLE QVariant | GetLegendPosition () const |
| Get the legend position. More... | |
| Q_INVOKABLE void | SetLegendPosition (const QVariant &legendPosition) |
| Set the legend position. More... | |
| Q_INVOKABLE QVariant | GetShowLegend () const |
| Get whether the legend is shown. More... | |
| Q_INVOKABLE void | SetShowLegend (const QVariant &show) |
| Set whether the legend is shown. More... | |
| Q_INVOKABLE QVariant | GetShowErrorBars () const |
| Get whether error bars are shown. More... | |
| Q_INVOKABLE void | SetShowErrorBars (const QVariant &show) |
| Set whether error bars are shown. More... | |
| Q_INVOKABLE QVariant | GetYAxisScale () const |
| Get the Y axis scale type. More... | |
| Q_INVOKABLE void | SetYAxisScale (const QVariant &YAxisScale) |
| Set the Y axis scale type. More... | |
| Q_INVOKABLE QVariant | GetShowSubchart () const |
| Get whether the subchart (overview navigator) is shown. More... | |
| Q_INVOKABLE void | SetShowSubchart (const QVariant &showSubchart) |
| Set whether the subchart (overview navigator) is shown. More... | |
| Q_INVOKABLE QVariant | GetUsePercentageInPieChart () const |
| Get whether percentages are shown in pie charts. More... | |
| Q_INVOKABLE void | SetUsePercentageInPieChart (const QVariant &usePercentageInPieChart) |
| Set whether percentages are shown in pie charts. More... | |
| Q_INVOKABLE QVariant | GetDataPointSize () const |
| Get the data point marker size. More... | |
| Q_INVOKABLE void | SetDataPointSize (const QVariant &showDataPoints) |
| Set the data point marker size. More... | |
| Q_INVOKABLE QVariant | GetStackedData () const |
| Get whether data is displayed in stacked mode. More... | |
| Q_INVOKABLE void | SetStackedData (const QVariant &stackedData) |
| Set whether data is displayed in stacked mode. More... | |
| Q_INVOKABLE QVariant | GetMinValueXView () const |
| Get the minimum X axis view value. More... | |
| Q_INVOKABLE void | SetMinValueXView (const QVariant &minValueXView) |
| Set the minimum X axis view value for zooming. More... | |
| Q_INVOKABLE QVariant | GetMaxValueXView () const |
| Get the maximum X axis view value. More... | |
| Q_INVOKABLE void | SetMaxValueXView (const QVariant &maxValueXView) |
| Set the maximum X axis view value for zooming. More... | |
| Q_INVOKABLE QVariant | GetMinValueYView () const |
| Get the minimum Y axis view value. More... | |
| Q_INVOKABLE void | SetMinValueYView (const QVariant &minValueYView) |
| Set the minimum Y axis view value for zooming. More... | |
| Q_INVOKABLE QVariant | GetMaxValueYView () const |
| Get the maximum Y axis view value. More... | |
| Q_INVOKABLE void | SetMaxValueYView (const QVariant &maxValueYView) |
| Set the maximum Y axis view value for zooming. More... | |
| void | EmitSignalImageUrl () |
| Emit the SignalImageUrl signal to trigger SVG export in JavaScript. More... | |
Properties | |
| QVariant | m_xAxisLabel |
| QVariant | m_yAxisLabel |
| QVariant | m_chartTitle |
| QVariant | m_themeName |
| QVariant | m_LegendPosition |
| QVariant | m_ShowLegend |
| QVariant | m_ShowErrorBars |
| QVariant | m_YAxisScale |
| QVariant | m_ShowSubchart |
| QVariant | m_UsePercentageInPieChart |
| QVariant | m_DataPointSize |
| QVariant | m_StackedData |
| QVariant | m_MinValueXView |
| QVariant | m_MaxValueXView |
| QVariant | m_MinValueYView |
| QVariant | m_MaxValueYView |
Detailed Description
Holds global chart properties for chart generation via QWebChannel.
This class stores chart-wide configuration properties such as axis labels, title, theme, legend settings, subchart visibility, axis scale, data point size, stacked mode, and view range limits. Properties are exposed via Q_PROPERTY so they can be sent to the JavaScript charting library (plotly) through QWebChannel.
- Note
- The actual per-series data points are held in QmitkChartxyData.
- See also
- QmitkChartWidget
- QmitkChartxyData
Definition at line 39 of file QmitkChartData.h.
Constructor & Destructor Documentation
◆ QmitkChartData()
| QmitkChartData::QmitkChartData | ( | ) |
Construct a QmitkChartData with default property values.
Member Function Documentation
◆ EmitSignalImageUrl()
|
inline |
Emit the SignalImageUrl signal to trigger SVG export in JavaScript.
Definition at line 275 of file QmitkChartData.h.
References SignalImageUrl().
◆ GetDataPointSize()
|
inline |
Get the data point marker size.
- Returns
- The data point size (0 means no markers), as a QVariant.
Definition at line 194 of file QmitkChartData.h.
References m_DataPointSize.
◆ GetLegendPosition()
|
inline |
Get the legend position.
- Returns
- The current legend position as a QVariant string.
Definition at line 124 of file QmitkChartData.h.
References m_LegendPosition.
◆ GetMaxValueXView()
|
inline |
Get the maximum X axis view value.
- Returns
- The maximum X view boundary as a QVariant.
Definition at line 231 of file QmitkChartData.h.
References m_MaxValueXView.
◆ GetMaxValueYView()
|
inline |
Get the maximum Y axis view value.
- Returns
- The maximum Y view boundary as a QVariant.
Definition at line 261 of file QmitkChartData.h.
References m_MaxValueYView.
◆ GetMinValueXView()
|
inline |
Get the minimum X axis view value.
- Returns
- The minimum X view boundary as a QVariant.
Definition at line 216 of file QmitkChartData.h.
References m_MinValueXView.
◆ GetMinValueYView()
|
inline |
Get the minimum Y axis view value.
- Returns
- The minimum Y view boundary as a QVariant.
Definition at line 246 of file QmitkChartData.h.
References m_MinValueYView.
◆ GetShowErrorBars()
|
inline |
Get whether error bars are shown.
- Returns
- true if error bars are visible, as a QVariant.
Definition at line 146 of file QmitkChartData.h.
References m_ShowErrorBars.
◆ GetShowLegend()
|
inline |
Get whether the legend is shown.
- Returns
- true if the legend is visible, as a QVariant.
Definition at line 135 of file QmitkChartData.h.
References m_ShowLegend.
◆ GetShowSubchart()
|
inline |
Get whether the subchart (overview navigator) is shown.
- Returns
- true if the subchart is visible, as a QVariant.
Definition at line 172 of file QmitkChartData.h.
References m_ShowSubchart.
◆ GetStackedData()
|
inline |
Get whether data is displayed in stacked mode.
- Returns
- true if stacked mode is active, as a QVariant.
Definition at line 205 of file QmitkChartData.h.
References m_StackedData.
◆ GetThemeName()
|
inline |
Get the current theme name.
- Returns
- The theme name (e.g. "dark" or "light") as a QVariant.
Definition at line 109 of file QmitkChartData.h.
References m_themeName.
◆ GetTitle()
|
inline |
Get the chart title.
- Returns
- The current chart title as a QVariant.
Definition at line 98 of file QmitkChartData.h.
References m_chartTitle.
◆ GetUsePercentageInPieChart()
|
inline |
Get whether percentages are shown in pie charts.
- Returns
- true if percentages are displayed, as a QVariant.
Definition at line 183 of file QmitkChartData.h.
References m_UsePercentageInPieChart.
◆ GetXAxisLabel()
|
inline |
Get the X axis label text.
- Returns
- The current X axis label as a QVariant.
Definition at line 76 of file QmitkChartData.h.
References m_xAxisLabel.
◆ GetYAxisLabel()
|
inline |
Get the Y axis label text.
- Returns
- The current Y axis label as a QVariant.
Definition at line 87 of file QmitkChartData.h.
References m_yAxisLabel.
◆ GetYAxisScale()
|
inline |
Get the Y axis scale type.
- Returns
- The axis scale identifier (e.g. "linear" or "log") as a QVariant.
Definition at line 161 of file QmitkChartData.h.
References m_YAxisScale.
◆ SetAppearance()
| void QmitkChartData::SetAppearance | ( | bool | showSubChart = true, |
| bool | usePercentageInPieChart = false |
||
| ) |
Configure appearance-related properties in a single call.
- Parameters
-
[in] showSubChart Whether to display a subchart (default: true). [in] usePercentageInPieChart Whether to show percentages in pie charts (default: false).
◆ SetDataPointSize()
|
inline |
Set the data point marker size.
- Parameters
-
[in] showDataPoints The marker size; 0 hides data point markers.
Definition at line 199 of file QmitkChartData.h.
References m_DataPointSize, and SignalDataPointSizeChanged().
◆ SetLegendPosition()
|
inline |
Set the legend position.
- Parameters
-
[in] legendPosition The position identifier (e.g. "topRight", "bottomMiddle").
Definition at line 129 of file QmitkChartData.h.
References m_LegendPosition, and SignalLegendPositionChanged().
◆ SetMaxValueXView()
|
inline |
Set the maximum X axis view value for zooming.
- Parameters
-
[in] maxValueXView The maximum X value to display.
Definition at line 236 of file QmitkChartData.h.
References m_MaxValueXView, and SignalMaxValueXViewChanged().
◆ SetMaxValueYView()
|
inline |
Set the maximum Y axis view value for zooming.
- Parameters
-
[in] maxValueYView The maximum Y value to display.
Definition at line 266 of file QmitkChartData.h.
References m_MaxValueYView, and SignalMaxValueYViewChanged().
◆ SetMinValueXView()
|
inline |
Set the minimum X axis view value for zooming.
- Parameters
-
[in] minValueXView The minimum X value to display.
Definition at line 221 of file QmitkChartData.h.
References m_MinValueXView, and SignalMinValueXViewChanged().
◆ SetMinValueYView()
|
inline |
Set the minimum Y axis view value for zooming.
- Parameters
-
[in] minValueYView The minimum Y value to display.
Definition at line 251 of file QmitkChartData.h.
References m_MinValueYView, and SignalMinValueYViewChanged().
◆ SetShowErrorBars()
|
inline |
Set whether error bars are shown.
- Parameters
-
[in] show true to show error bars, false to hide them.
Definition at line 151 of file QmitkChartData.h.
References m_ShowErrorBars, and SignalShowErrorBarsChanged().
◆ SetShowLegend()
|
inline |
Set whether the legend is shown.
- Parameters
-
[in] show true to show the legend, false to hide it.
Definition at line 140 of file QmitkChartData.h.
References m_ShowLegend, and SignalShowLegendChanged().
◆ SetShowSubchart()
|
inline |
Set whether the subchart (overview navigator) is shown.
- Parameters
-
[in] showSubchart true to display the subchart, false to hide it.
Definition at line 177 of file QmitkChartData.h.
References m_ShowSubchart, and SignalShowSubchartChanged().
◆ SetStackedData()
|
inline |
Set whether data is displayed in stacked mode.
- Parameters
-
[in] stackedData true to stack data series.
Definition at line 210 of file QmitkChartData.h.
References m_StackedData, and SignalStackedDataChanged().
◆ SetThemeName()
|
inline |
Set the chart theme name.
- Parameters
-
[in] themeName The theme identifier string (e.g. "dark", "light").
Definition at line 114 of file QmitkChartData.h.
References m_themeName, and SignalThemeNameChanged().
◆ SetTitle()
|
inline |
Set the chart title.
- Parameters
-
[in] title The title text to display above the chart.
Definition at line 103 of file QmitkChartData.h.
References m_chartTitle, and SignalTitleChanged().
◆ SetUsePercentageInPieChart()
|
inline |
Set whether percentages are shown in pie charts.
- Parameters
-
[in] usePercentageInPieChart true to show percentage labels.
Definition at line 188 of file QmitkChartData.h.
References m_UsePercentageInPieChart, and SignalUsePercentageInPieChartChanged().
◆ SetXAxisLabel()
|
inline |
Set the X axis label text.
- Parameters
-
[in] label The label text to display on the X axis.
Definition at line 81 of file QmitkChartData.h.
References m_xAxisLabel, and SignalXAxisLabelChanged().
◆ SetYAxisLabel()
|
inline |
Set the Y axis label text.
- Parameters
-
[in] label The label text to display on the Y axis.
Definition at line 92 of file QmitkChartData.h.
References m_yAxisLabel, and SignalYAxisLabelChanged().
◆ SetYAxisScale()
|
inline |
Set the Y axis scale type.
- Parameters
-
[in] YAxisScale The axis scale identifier (e.g. "linear" or "log").
Definition at line 166 of file QmitkChartData.h.
References m_YAxisScale, and SignalYAxisScaleChanged().
◆ SignalDataPointSizeChanged
|
signal |
Emitted when data point size changes.
Referenced by SetDataPointSize().
◆ SignalImageUrl
|
signal |
Emitted to request the chart image URL from JavaScript for SVG export.
Referenced by EmitSignalImageUrl().
◆ SignalLegendPositionChanged
|
signal |
Emitted when the legend position changes.
Referenced by SetLegendPosition().
◆ SignalMaxValueXViewChanged
|
signal |
Emitted when maximum X view value changes.
Referenced by SetMaxValueXView().
◆ SignalMaxValueYViewChanged
|
signal |
Emitted when maximum Y view value changes.
Referenced by SetMaxValueYView().
◆ SignalMinValueXViewChanged
|
signal |
Emitted when minimum X view value changes.
Referenced by SetMinValueXView().
◆ SignalMinValueYViewChanged
|
signal |
Emitted when minimum Y view value changes.
Referenced by SetMinValueYView().
◆ SignalShowErrorBarsChanged
|
signal |
Emitted when error bar visibility changes.
Referenced by SetShowErrorBars().
◆ SignalShowLegendChanged
|
signal |
Emitted when legend visibility changes.
Referenced by SetShowLegend().
◆ SignalShowSubchartChanged
|
signal |
Emitted when subchart visibility changes.
Referenced by SetShowSubchart().
◆ SignalStackedDataChanged
|
signal |
Emitted when stacked data mode changes.
Referenced by SetStackedData().
◆ SignalThemeNameChanged
|
signal |
Emitted when the theme changes.
Referenced by SetThemeName().
◆ SignalTitleChanged
|
signal |
Emitted when the chart title changes.
Referenced by SetTitle().
◆ SignalUsePercentageInPieChartChanged
|
signal |
Emitted when pie chart percentage mode changes.
Referenced by SetUsePercentageInPieChart().
◆ SignalXAxisLabelChanged
|
signal |
Emitted when the X axis label changes.
Referenced by SetXAxisLabel().
◆ SignalYAxisLabelChanged
|
signal |
Emitted when the Y axis label changes.
Referenced by SetYAxisLabel().
◆ SignalYAxisScaleChanged
|
signal |
Emitted when the Y axis scale changes.
Referenced by SetYAxisScale().
◆ slotImageUrl
|
inlineslot |
Slot that receives an SVG image URL from JavaScript and saves it to a file.
Decodes the percent-encoded SVG data, prompts the user with a file dialog, and writes the SVG content to the selected file.
- Parameters
-
[in] datafromjs The percent-encoded SVG data URL from JavaScript.
Definition at line 308 of file QmitkChartData.h.
Property Documentation
◆ m_chartTitle
|
readwrite |
Definition at line 1 of file QmitkChartData.h.
Referenced by GetTitle(), and SetTitle().
◆ m_DataPointSize
|
readwrite |
Definition at line 1 of file QmitkChartData.h.
Referenced by GetDataPointSize(), and SetDataPointSize().
◆ m_LegendPosition
|
readwrite |
Definition at line 1 of file QmitkChartData.h.
Referenced by GetLegendPosition(), and SetLegendPosition().
◆ m_MaxValueXView
|
readwrite |
Definition at line 1 of file QmitkChartData.h.
Referenced by GetMaxValueXView(), and SetMaxValueXView().
◆ m_MaxValueYView
|
readwrite |
Definition at line 1 of file QmitkChartData.h.
Referenced by GetMaxValueYView(), and SetMaxValueYView().
◆ m_MinValueXView
|
readwrite |
Definition at line 1 of file QmitkChartData.h.
Referenced by GetMinValueXView(), and SetMinValueXView().
◆ m_MinValueYView
|
readwrite |
Definition at line 1 of file QmitkChartData.h.
Referenced by GetMinValueYView(), and SetMinValueYView().
◆ m_ShowErrorBars
|
readwrite |
Definition at line 1 of file QmitkChartData.h.
Referenced by GetShowErrorBars(), and SetShowErrorBars().
◆ m_ShowLegend
|
readwrite |
Definition at line 1 of file QmitkChartData.h.
Referenced by GetShowLegend(), and SetShowLegend().
◆ m_ShowSubchart
|
readwrite |
Definition at line 1 of file QmitkChartData.h.
Referenced by GetShowSubchart(), and SetShowSubchart().
◆ m_StackedData
|
readwrite |
Definition at line 1 of file QmitkChartData.h.
Referenced by GetStackedData(), and SetStackedData().
◆ m_themeName
|
readwrite |
Definition at line 1 of file QmitkChartData.h.
Referenced by GetThemeName(), and SetThemeName().
◆ m_UsePercentageInPieChart
|
readwrite |
Definition at line 1 of file QmitkChartData.h.
Referenced by GetUsePercentageInPieChart(), and SetUsePercentageInPieChart().
◆ m_xAxisLabel
|
readwrite |
Definition at line 1 of file QmitkChartData.h.
Referenced by GetXAxisLabel(), and SetXAxisLabel().
◆ m_yAxisLabel
|
readwrite |
Definition at line 1 of file QmitkChartData.h.
Referenced by GetYAxisLabel(), and SetYAxisLabel().
◆ m_YAxisScale
|
readwrite |
Definition at line 1 of file QmitkChartData.h.
Referenced by GetYAxisScale(), and SetYAxisScale().
The documentation for this class was generated from the following file: