|
Medical Imaging Interaction Toolkit
2016.11.0
Medical Imaging Interaction Toolkit
|
|
Medical Imaging Interaction Toolkit
2016.11.0
Medical Imaging Interaction Toolkit
|
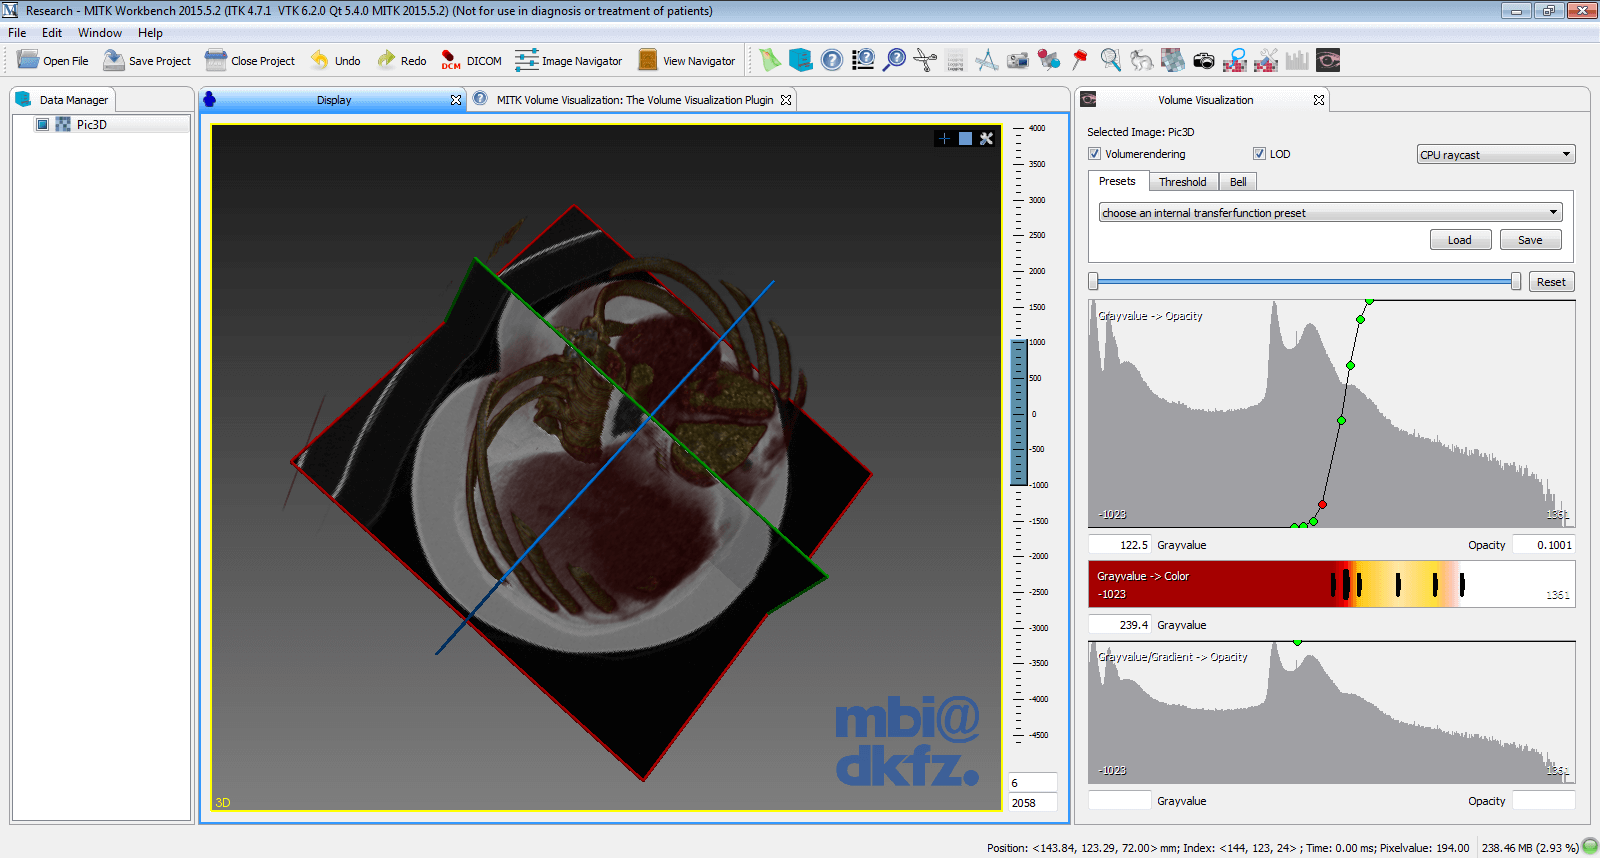
The Volume Visualization Plugin is a basic tool for visualizing three dimensional medical images. MITK provides generic transfer function presets for medical CT data. These functions, that map the gray-value to color and opacity, can be interactively edited. Additionally, there are controls to quickly generate common used transfer function shapes like the threshold and bell curve to help identify a range of grey-values.
Load an image into the application by
Volume Visualization imposes following restrictions on images:
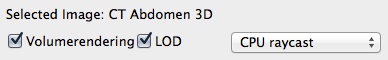
Select an image in datamanager and click on the checkbox left of "Volumerendering". Please be patient, while the image is prepared for rendering, which can take up to a half minute.
Volume Rendering requires a lot of computing resources including processor, memory and graphics card.
To run volume rendering on smaller platforms, enable the LOD checkbox (level-of-detail rendering). Level-of-detail first renders a lower quality preview to increase interactivity. If the user stops to interact a normal quality rendering is issued.
The GPU checkbox tries to use computing resources on the graphics card to accelerate volume rendering. It requires a powerful graphics card and OpenGL hardware support for shaders, but achieves much higher frame rates than software-rendering.
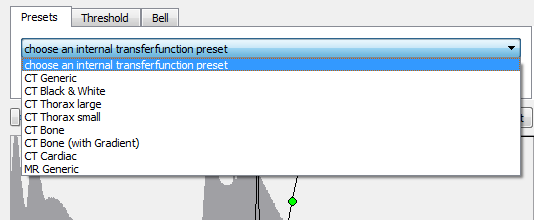
There are some internal presets given, that can be used with normal CT data (given in Houndsfield units). A large set of medical data has been tested with that presets, but it may not suit on some special cases.
Click on the "Preset" tab for using internal or custom presets.
After creating or editing a transferfunction (see Customize transferfunctions in detail or Interactively create transferfunctions), the custom transferfunction can be stored and later retrieved on the filesystem. Click "Save" (respectively "Load") button to save (load) the threshold-, color- and gradient function combined in a single .xml file.
Beside the possibility to directly edit the transferfunctions (Customize transferfunctions in detail), a one-click generation of two commonly known shapes is given.
Both generators have two parameters, that can be modified by first clicking on the cross and then moving the mouse up/down and left/right.
The first parameter "center" (controlled by horizontal movement of the mouse) specifies the gravalue where the center of the shape will be located.
The second parameter "width" (controlled by vertical movement of the mouse) specifies the width (or steepness) of the shape.
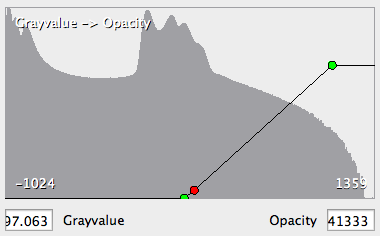
Click on the "Threshold" tab to active the threshold function generator.
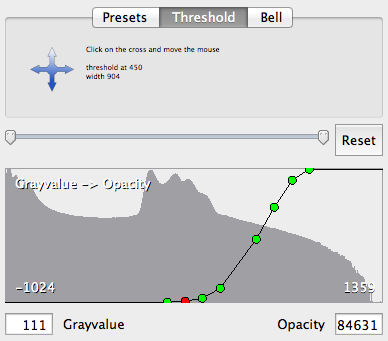
A threshold shape begins with zero and raises to one across the "center" parameter. Lower widths results in steeper threshold functions.
Click on the "Bell" tab to active the threshold function generator.
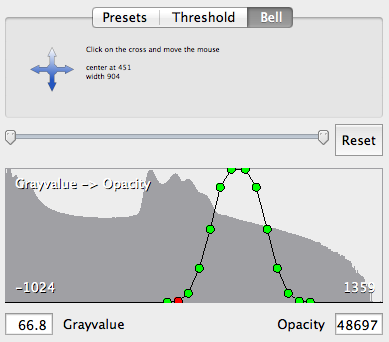
A threshold shape begins with zero and raises to one at the "center" parameter and the lowers agains to zero. The "width" parameter correspondens to the width of the bell.
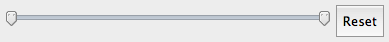
To navigate across the grayvalue range or to zoom in some ranges use the "range"-slider.
All three function editors have in common following:
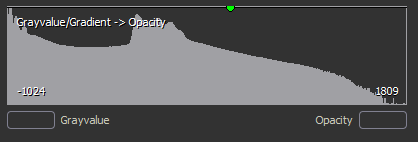
There are three transferfunctions to customize:
An opacity of 0 means total transparent, an opacity of 1 means total opaque.
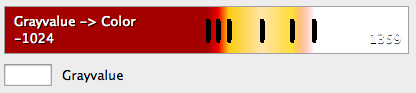
The color transferfunction editor also allows by double-clicking a point to change its color.
Here the influence of the gradient is controllable at specific grayvalues.
 1.8.9.1
