|
Medical Imaging Interaction Toolkit
2016.11.0
Medical Imaging Interaction Toolkit
|
|
Medical Imaging Interaction Toolkit
2016.11.0
Medical Imaging Interaction Toolkit
|

This view provides an easy interface to quickly compute some features of a whole image or a region of interest.
This document will tell you how to use this view, but it is assumed that you already know how to use MITK in general.
Please see Details for more detailed information on usage and supported filters. If you encounter problems using the view, please have a look at the Troubleshooting page.
Manual sections:
This view provides an easy interface to quickly compute some features of a whole image or a region of interest.
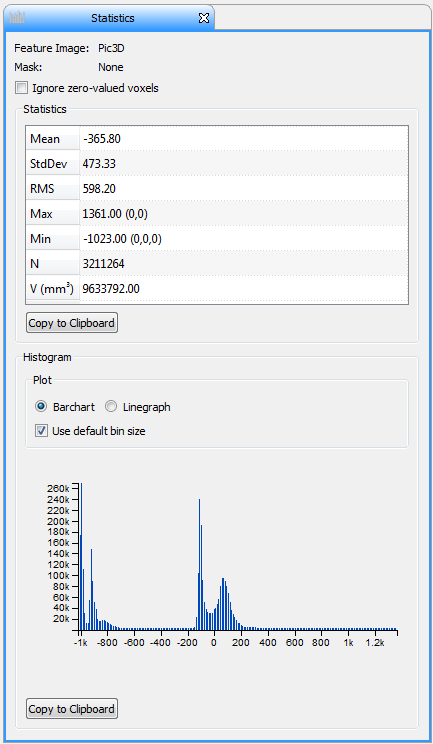
After selection of an image or a binary mask of an image in the datamanager, the Image Statistics view shows some statistical information. If a mask is selected, the name of the mask and the name of the image, to which the mask is applied, are shown at the top. For time data the current time step is used for the selected mask and the selected image. If the total number of time steps on the selected mask is less than the current time step, the last time step of the mask is used. If a mask is selected, its used time step will be displayed next to its name like this: (t=0).
Check "Ignore zero-valued voxels" to hide voxels with grayvalue zero.
Below it is the statistics window which displays the calculated statistical features (such as mean, standard deviation...).
Beneath the statistics window is the histogram window, which shows the histogram of the current selection.
At top of the histogram window are two radiobuttons. Toggle one of them to either show the histogram as a barchart or as a lineplot.
Use mousewheel to zoom in and out the histogram. With the left mouse button the histogram is pannable in zoomed state.
If the histogram is displayed as a barchart a tooltip is available by hovering over one of the bins. A tooltip is also available, if an intesity profile is created for a path element as mask.
At the bottom of each view is one button. They copy their respective data in csv format to the clipboard.
No known problems.
All other problems.
Please report to the MITK mailing list. See http://www.mitk.org/wiki/Mailinglist on how to do this.
 1.8.9.1
