|
Medical Imaging Interaction Toolkit
2016.11.0
Medical Imaging Interaction Toolkit
|
|
Medical Imaging Interaction Toolkit
2016.11.0
Medical Imaging Interaction Toolkit
|
Some of the features described below are closed source additions to the open source toolkit MITK and are not available in every application.
The Segmentation plugin allows you to create segmentations of anatomical and pathological structures in medical images of the human body. The plugin consists of a number of view which can be used for:
The segmentation plugin offers a number of preferences which can be set via the MITK Workbench application preference dialog:
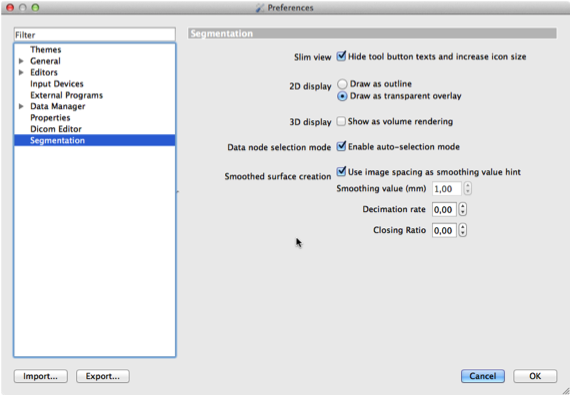
The following preferences can be set:
If you wonder what segmentations are good for, we shortly revisit the concept of a segmentation here. A CT or MR image is made up of volume of physical measurements (volume elements are called voxels). In CT images, for example, the gray value of each voxel corresponds to the mass absorbtion coefficient for X-rays in this voxel, which is similar in many parts of the human body. The gray value does not contain any further information, so the computer does not know whether a given voxel is part of the body or the background, nor can it tell a brain from a liver. However, the distinction between a foreground and a background structure is required when:
Creating this distinction between foreground and background is called segmentation. The Segmentation perspective of the MITK Workbench uses a voxel based approach to segmentation, i.e. each voxel of an image must be completely assigned to either foreground or background. This is in contrast to some other applications which might use an approach based on contours, where the border of a structure might cut a voxel into two parts.
The remainder of this document will summarize the features of the Segmentation perspective and how they are used.
The Segmentation perspective makes a number of assumptions. To know what this view can be used for, it will help you to know that:
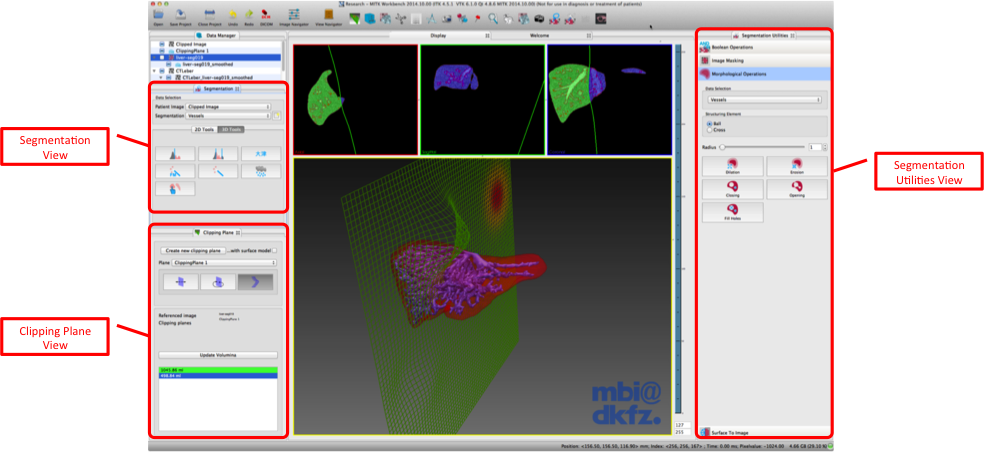
The Segmentation perspective makes use of the Data Manager view to give you an overview of all images and segmentations.
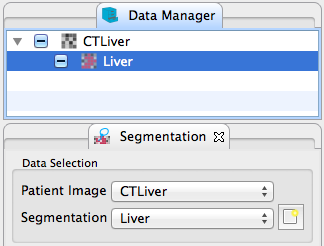
To select the reference image (e.g. the original CT/MR image) use the patient image drop down box in the control area of the Segmentation view. The segmentation image selected in the Data Manager is displayed below in the segmentation drop down box. By default the auto selection mode is enabled, which always keeps the selection of the segmentation drop down box in synch with the selection in the data manager. If you disable the auto selection mode the selection of the right segmentation image has to be done via the drop down box. If no segmentation image exists or none is selected create a new segmentation image by using the "New segmentation" button on the right of the Segmentation drop down box. Some items of the graphical user interface might be disabled when no image is selected or the selected image does not fit to the patient image's geoemtry. In any case, the application will give you hints if a selection is needed.
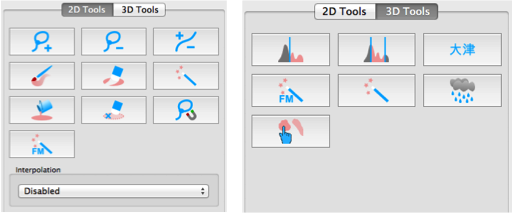
MITK comes with a comprehensive set of segmentation tools. These tools can be differenciated between manual slice-based 2D segmentation tools and (semi-)automated 3D tools. The manual 2D tools require a big amount of user interaction and can only be applied to a single image slice whereas the 3D tools operate on the hole image. The 3D tools usually require a small amount of interaction like placin seedpoints of setting some parameters. You can switch between the different toolsets by switching the 2D/3D tab in the segmentation view.
With manual contouring you define which voxels are part of the segmentation and which are not. This allows you to create segmentations of any structeres that you may find in an image, even if they are not part of the human body. You might also use manual contouring to correct segmentations that result from sub-optimal automatic methods. The drawback of manual contouring is that you might need to define contours on many 2D slices. However, this is moderated by the interpolation feature, which will make suggestions for a segmentation.
Unless you want to edit existing segmentations, you have to create a new, empty segmentation before you can edit it. To do so, click the "New manual segmentation" button. Input fields will appear where you can choose a name for the new segmentation and a color for its display. Click the checkmark button to confirm or the X button to cancel the new segmentation. Notice that the input field suggests names once you start typing and that it also suggests colors for known organ names. If you use names that are not yet known to the application, it will automatically remember these names and consider them the next time you create a new segmentation.
Once you created a new segmentation, you can notice a new item with the "binary mask" icon in the Data Manager tree view. This item is automatically selected for you, allowing you to start editing the new segmentation right away.
As you might want to have segmentations of multiple structures in a single patient image, the application needs to know which of them to use for editing. You select a segmenation by clicking it in the tree view of Data Manager. Note that segmentations are usually displayed as sub-items of "their" patient image. In the rare case, where you need to edit a segmentation that is not displayed as a a sub-item, you can click both the original image AND the segmentation while holding down CTRL or for Mac OS X the CMD on the keyboard.
When a selection is made, the Segmentation View will hide all but the selected segmentation and the corresponding original image. When there are multiple segmentations, the unselected ones will remain in the Data Manager, you can make them visible at any time by selecting them.
If you are familiar with the MITK Workbench, you know that clicking and moving the mouse in any of the 2D render windows will move around the crosshair that defines what part of the image is displayed. This behavior is disabled while any of the manual segmentation tools are active – otherwise you might have a hard time concentrating on the contour you are drawing.
To start using one of the editing tools, click its button the the displayed toolbox. The selected editing tool will be active and its corresponding button will stay pressed until you click the button again. Selecting a different tool also deactivates the previous one.
If you have to delineate a lot of images, you should try using shortcuts to switch tools. Just hit the first letter of each tool to activate it (A for Add, S for Subtract, etc.).
All of the editing tools work by the same principle: you use the mouse (left button) to click anywhere in a 2D window (any of the orientations axial, sagittal, or frontal), move the mouse while holding the mouse button and release to finish the editing action.
Multi-step undo and redo is fully supported by all editing tools. Use the application-wide undo button in the toolbar to revert erroneous actions.
Use the left mouse button to draw a closed contour. When releasing the mouse button, the contour will be added (Add tool) to or removed from (Subtract tool) the current segmentation. Hold down the CTRL / CMD key to invert the operation (this will switch tools temporarily to allow for quick corrections).

Use the slider below the toolbox to change the radius of these round paintbrush tools. Move the mouse in any 2D window and press the left button to draw or erase pixels. As the Add/Subtract tools, holding CTRL / CMD while drawing will invert the current tool's behavior.

Click at one point in a 2D slice widget to add an image region to the segmentation with the region growing tool. Moving up the cursor while holding the left mouse button widens the range for the included grey values; moving it down narrows it. Moving the mouse left and right will shift the range.
Region Growing selects all pixels around the mouse cursor that have a similar gray value as the pixel below the mouse cursor. This enables you to quickly create segmentations of structures that have a good contrast to surrounding tissue, e.g. the lungs. The tool will select more or less pixels (corresponding to a changing gray value interval width) when you move the mouse up or down while holding down the left mouse button.

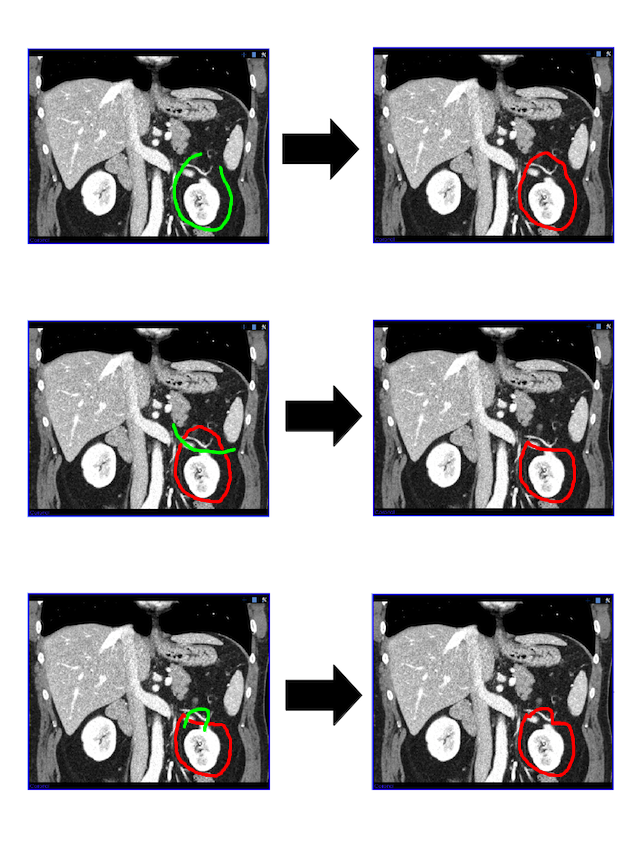
You do not have to draw a closed contour to use the Correction tool and do not need to switch between the Add and Substract tool to perform small corrective changes. The following figure shows the usage of this tool:
Left-click inside a segmentation with holes to completely fill all holes (left-click outside a segmentation).
This tool removes a connected part of pixels that form a segmentation. You may use it to remove so called islands (see picture) or to clear a whole slice at once (left-click outside a segmentation).

The LiveWire Tool acts as a magnetic lasso with a contour snapping to edges of objects.

The contour will be transfered to its binary image representation by deactivating the tool.

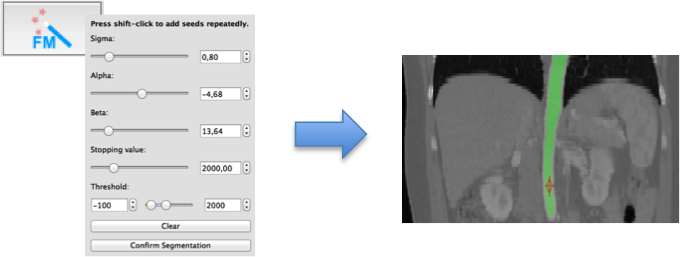
Provides a fast marching based 2D interaction segmentation tool. You start with setting seedpoints in an image slice. Via several sliders you can adapt parameters and see the fast marching result instantly.
Creating segmentations for modern CT volumes is very time-consuming, because structures of interest can easily cover a range of 50 or more slices. The Manual Segmentation View offers two helpful features for these cases:
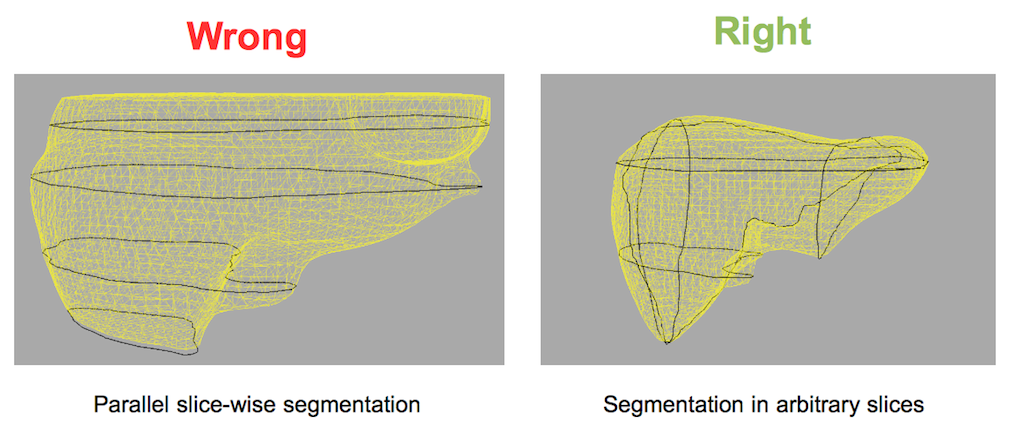
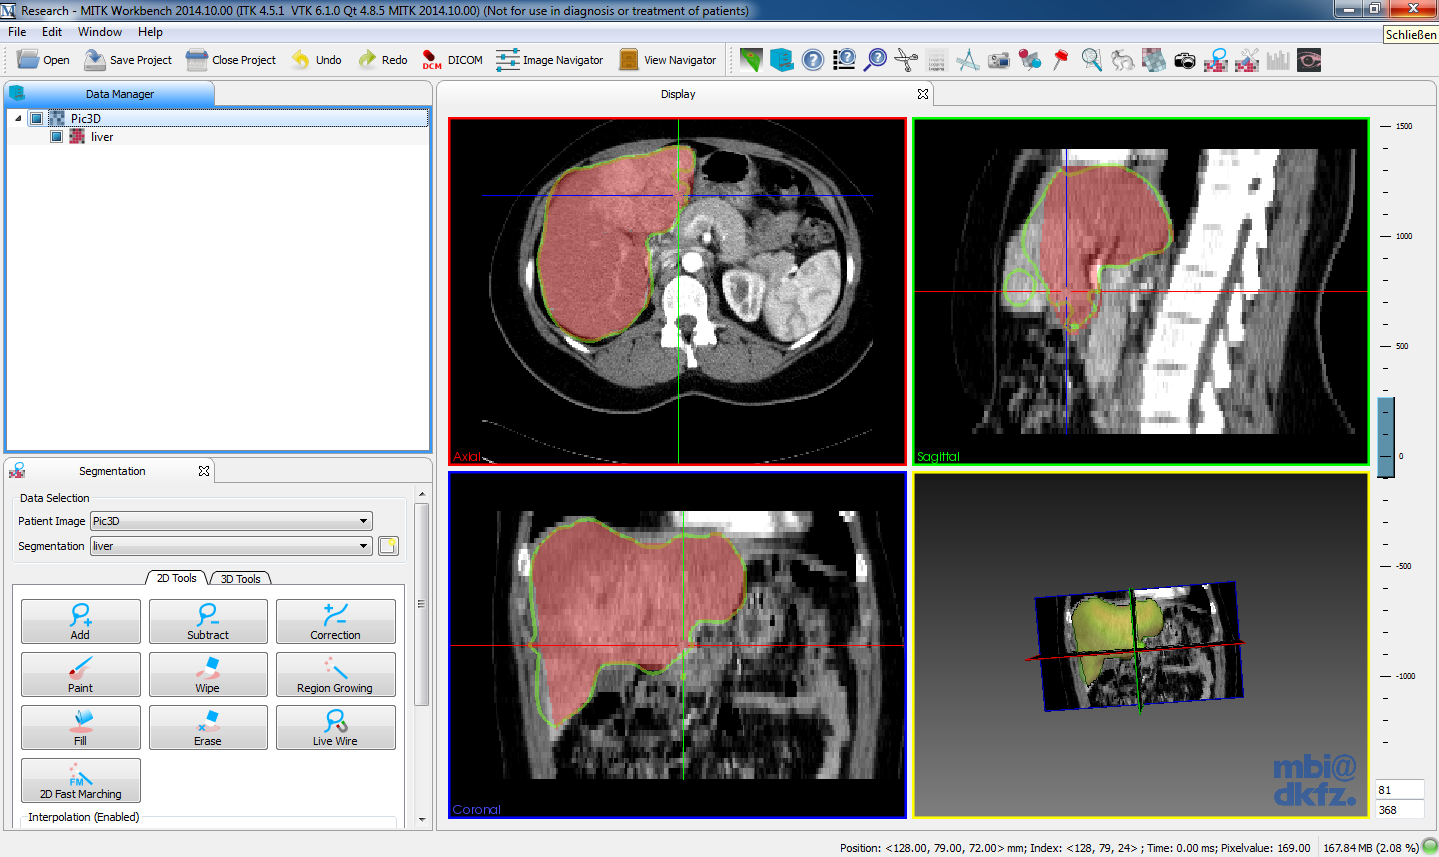
The 3D interpolation is activated by default when using the manual segmentation tools. That means if you start contouring, from the second contour onwards, the surface of the segmented area will be interpolated based on the given contour information. The interpolation works with all available manual tools. Please note that this is currently a pure mathematical interpolation, i.e. image intensity information is not taken into account. With each further contour the interpolation result will be improved, but the more contours you provide the longer the recalculation will take. To achieve an optimal interpolation result and in this way a most accurate segmentation you should try to describe the surface with sparse contours by segmenting in arbitrary oriented planes. The 3D interpolation is not meant to be used for parallel slice-wise segmentation.
You can accept the interpolation result by clicking the "Accept" - button below the tool buttons. In this case the 3D interpolation will be deactivated automatically so that the result can be postprocessed without any interpolation running in background. During recalculation the interpolated surface is blinking yellow/white. When the interpolation has finished the surface is shown yellow with a small opacity. Additional to the surface, black contours are shown in the 3D render window. They mark the positions of all the drawn contours which were used for the interpolation. You can navigate between the drawn contours by clicking on the „Position“ - Nodes in the datamanager which are located below the selected segmentation. If you don't want to see these nodes just unckeck the „Show Position Nodes“ Checkbox and these nodes will be hidden. If you want to delete a drawn contour we recommend to use the Erase-Tool since Redo/Undo is not yet working for 3D interpolation. The current state of the 3D interpolation can be saved accross application restart. Therefor just click on save project during the interpolation is active. After restarting the application and load your project you can click on "Reinit Interpolation" within the 3D interpolation GUI area.
The 2D Interpolation creates suggestions for a segmentation whenever you have a slice that
Interpolated suggestions are displayed in a different way than manual segmentations are, until you "accept" them as part of the segmentation. To accept single slices, click the "Accept" button below the toolbox. If you have segmented a whole organ in every-x-slice, you may also review the interpolations and then accept all of them at once by clicking "... all slices".
The 3D tools operate on the hole image and require usually a small amount of interaction like placing seed-points or specifying certain parameters. All 3D tools provide an immediate segmentation feedback, which is displayed as a transparent green overlay. For accepting a preview you have to press the "Comfirm" button of the selected tool. The following 3D tools are at your disposal:
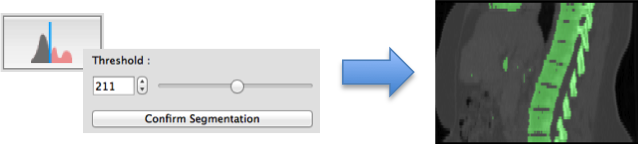
The Thresholding tool simply applies a 3D threshold to the patient image. All pixels with values equal or above the selected threshold are labeled. You can change the threshold by either moving the slider of setting a certain value in the spinbox.
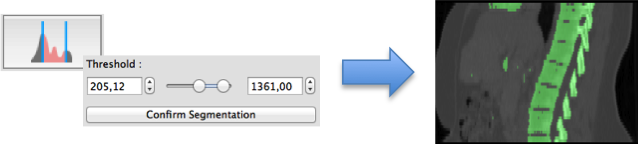
The Upper/Lower Thresholding tool works similar to the simple 3D threshold tool but allows you to define an upper and lower threshold. All pixels with values within this threshold intervall will be labeled
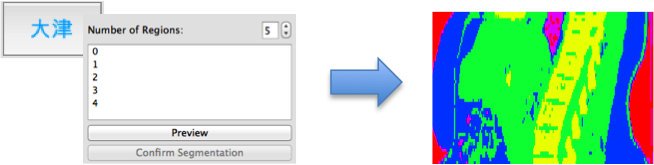
The 3D Otsu tool provides a more sophisticated thresholding algorithm. It allows you to define a number of regions. Based on the image histogram the pixels will then divided into different regions. There more regions you define the longer will the calculation take.
The 3D Fast Marching tools works similar to the 2D pendant but on the hole image. Depending on you image's size the calculation will take some time. You can interactive set the parameters of the algorithm via the tool GUI.
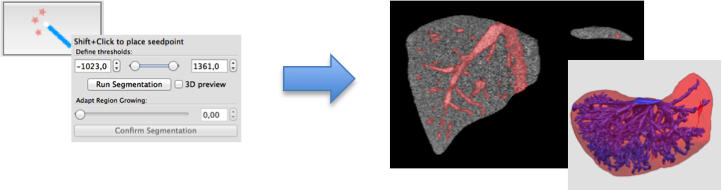
The 3D Region Growing tool works similar to the 2D pendant. At the beginning you have to place a seedpoint and define a threshold intervall. If you press "Run segmentation" a preview is calculated, if the "3D preview" box is checked you will also see the result in 3D. By moving the "Adapt region growing slider" you can interactively adapt the result to you image.
+
This tool provides a watershed based segmentation algorithm.

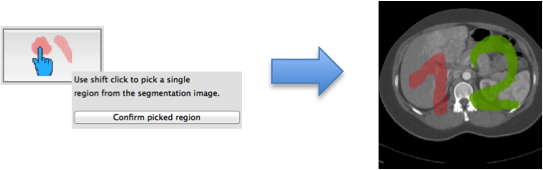
The Picking tool allows you to select islands within your segmentation. This is especially usefull if e.g. a thresholding delivered your several areas within your image but you are just interested in one special region.
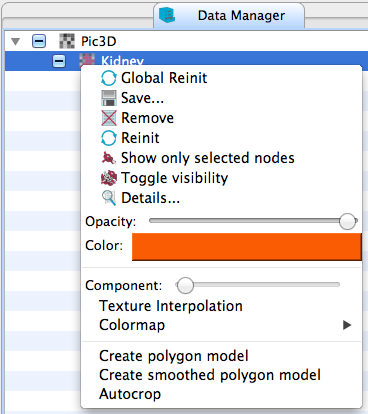
As mentioned in the introduction, segmentations are never an end in themselves. Consequently, the Segmentation view adds a couple of "post-processing" actions to the Data Manager. These actions are accessible through the context-menu of segmentations in Data Manager's list view
You can use the surface masking tool to create binary images from a surface which is used used as a mask on an image. This task is demonstrated below:
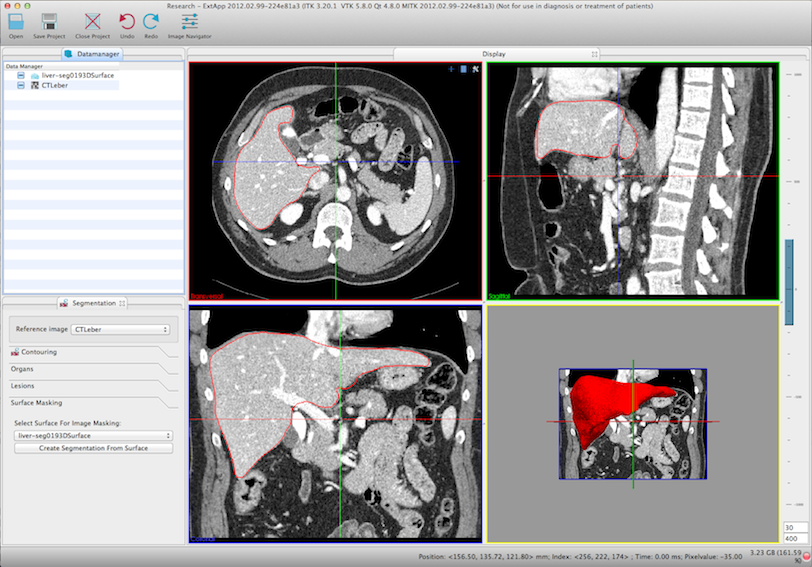
Select the image and the surface in the corresponding drop-down boxes (both are selected automatically if there is just one image and one surface)
After clicking "Create segmentation from surface" the newly created binary image is inserted in the DataManager and can be used for further processing
For technical specifications see Technical design of QmitkSegmentation and for information on the extensions of the tools system How to extend the Segmentation view with external tools .
 1.8.9.1
