Table of Contents
Overview
The Volume Visualization Plugin is a basic tool for volume rendering of three dimensional medical images. MITK provides generic transfer function presets for medical CT and MRT data. These functions that map the gray-value to color and opacity can be interactively edited. Additionally, there are controls to quickly generate commonly used transfer function shapes like the threshold and bell curve to help identify a range of grey-values.
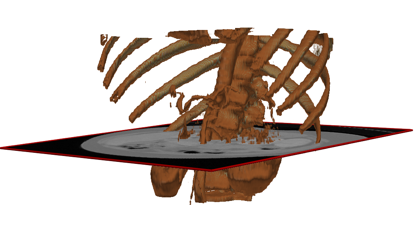
Volume Rendering
Select an image and enable volume rendering
Select an image on top of the view and click on the checkbox left of 'Volume rendering'.
- Note
- Volume Visualization imposes following restrictions on images:
- It has to be a 3D scalar image, that means e.g. a CT or MRT image.
- 3D+t images are supported for rendering, but the histograms are not computed.
- Also be aware that volume visualization requires a huge amount of memory. Very large images may not work unless you use the 64bit version.
Dropdown menu for the blend modes
Two dropdown menu is located right next to the 'Volume rendering' checkbox. It allows you to select a blend mode (Composite, Maximum intensity, Minimum intensity, Average intensity, and Additive intensity).
Blend modes define how the volume voxels, intersected by the rendering rays, are pooled. The 'Composite' mode specifies standard volume rendering, for which each voxel contributes equally with opacity and color. Other 'blend' modes visualize the voxel of the maximum or minimum intensity or average or add the intensities along the rendering ray.
Applying premade presets
Internal presets
There are some internal presets given that can be used with normal CT data (given in Houndsfield units). A large set of medical data has been tested with those presets, but they may not suit some special cases.
Click on the 'Preset' tab for using internal or custom presets.
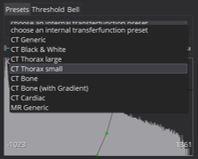
- 'CT Generic' is the default transfer function that is first applied.
- 'CT Black&White' does not use any colors for the volume visualization as it may be distracting on some data.
- 'CT Cardiac' is well-suited for CT images containing the heart.
- 'CT Bone' emphasizes bones and shows other areas more transparent.
- 'CT Bone (Gradient)' is like 'CT Bone' but shows only the surface from other organs by using the gradient.
- 'MR Generic' is the default transfer function that can be used on MRT data (which is not normalized like CT data).
- 'CT Thorax small' is useful if only a proportion of the thorax is selected to emphasize details.
- 'CT Thorax large' is useful if a large proportion or the entire thorax is selected to emphasize details.
Saving and loading custom presets
After creating or editing a transfer function (see Customize transfer functions in detail or Interactively create transfer functions), the custom transfer function can be stored and later retrieved on the filesystem. Click 'Save' (respectively 'Load') button below the preset selection to save (load) the threshold-, color- and gradient function combined in a single .xml file.
Interactively create transfer functions
Besides the possibility to directly edit the transfer functions (Customize transfer functions in detail), the plugin provides two commonly known shapes to quickly generate transfer functions with a few clicks. Both generators have two parameters that can be modified by first clicking on the cross and then moving the mouse up/down and left/right.
The first parameter 'center' (controlled by horizontal movement of the mouse) specifies the gray value where the center of the shape will be located.
The second parameter 'width' (controlled by vertical movement of the mouse) specifies the width (or steepness) of the shape.
Threshold
Click on the 'Threshold' tab to activate the threshold function generator.
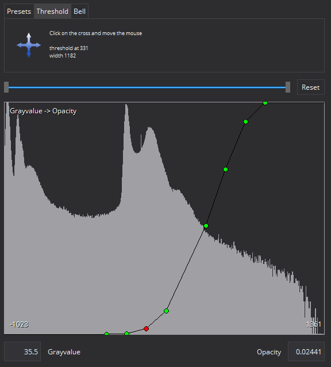
A threshold shape begins with zero and raises to one across the 'center' parameter. Lower widths result in steeper threshold functions.
Bell
Click on the 'Bell' tab to activate the bell-shaped threshold function generator.
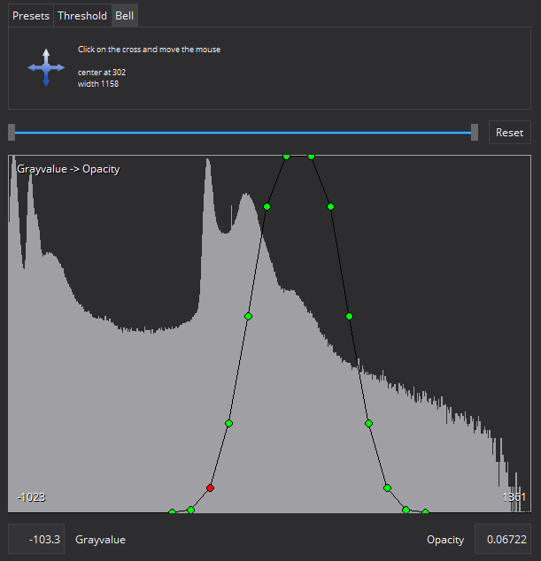
A threshold shape begins with zero and raises to one at the 'center' parameter and then lowers again to zero. The 'width' parameter corresponds to the width of the bell.
Customize transfer functions in detail
Choosing gray value interval to edit

To navigate across the gray value range or to zoom in some ranges use the 'range'-slider.
All three function editors have in common following:
- By left-clicking a new point is added.
- By right-clicking a point is deleted.
- By left-clicking and holding, an existing point can be dragged.
- By pressing arrow keys, the currently selected point is moved.
- By pressing the 'DELETE' key, the currently selected point is deleted.
- Between points the transferfunctions are linear interpolated.
There are three transfer functions to customize:
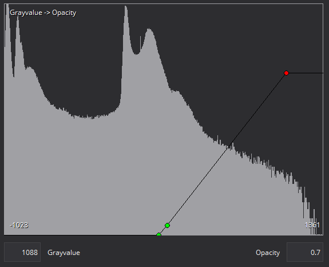
Grayvalue -> Opacity
An opacity of 0 means total transparent, an opacity of 1 means total opaque. The opacity editor allows changing the opacity for all gray values independently. You can alter the position of control points using your mouse. You can add control points by left-clicking on the graph. To remove a control point again you can right-click on the respective point.
Grayvalue -> Color
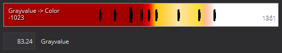
The color transfer function editor also allows you to change its color by double-clicking a point. You can add color control points by left-clicking on the color bar. To remove a control point again right-click on the respective point.
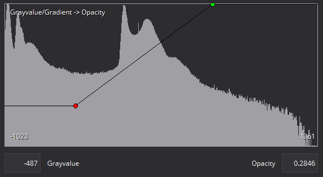
Grayvalue and Gradient -> Opacity
The gradient editor allows you to change the gradient influence for all gray values independently. You can move the existing control points using your mouse. Additionally, you can add control points by left-clicking on the graph. To remove a control point again, right-click on the respective point.