Measuring- and Marking-Tools
For a short explanation of the navigation through the tutorial, press DOWN.
Navigation through the tutorial slides
In the lower right corner you see four little arrows showing you the ways you can go from this slide.

If an arrow turns bold, you can follow it in this direction, if you want to.
(For example videos with additional information about the current topic, are always in these "basement slides".)
Besides the arrow keys you can also use the space bar, it navigates you through every single slide.
When you press "Esc", you will see an overview about all the available slides.
With Alt + clicking on a certain spot in the slide, you can zoom in.
Measurements
As the name of this Plugin suggests, it enables you to measure certain sizes.

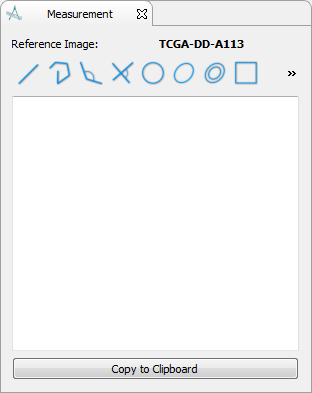
You can choose from several geometrical structures.
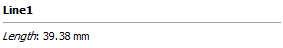
After creating your measurement, it shows up
in the data manager and in this white box,
together with the measured values.
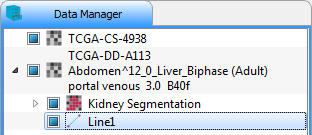
Note: To get displayed several measurements,
mark all of them in the data manager.
Pointsets Interaction
To highlight a couple of landmarks, use the PointSets Interaction Plugin.

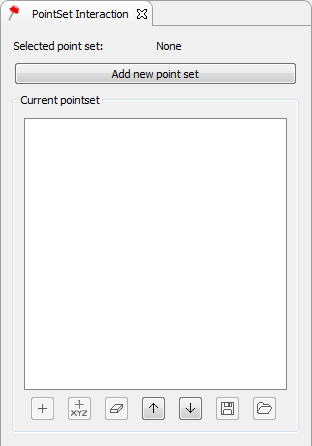
First you have to create a new set of points.

Now you're able to work with your points:

- Define new points
(by holding Shift + clicking) - Delete points
- Move their order
- Save this set
- Open another set
Statistics
With the Statistics Plugin, you can get some interesting values:

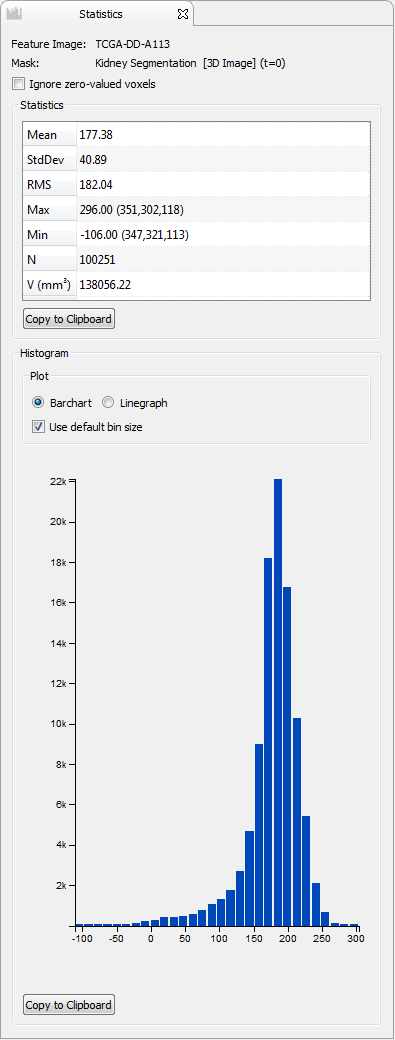
- Mean
- Standard Deviation
- Root Mean Square (RMS)
- Maximum
- Minimum
- Amount of Pixels (N)
- Volume
For this you have to mark one image and a region of interest,
which could be either a segmentation or a geometrical structure,
in the data manager.
The histogram displays the distribution of the grey values.
Thank you!
Press F1, to get fast access
to the documentation of the Plugin you're currently using!
Try it now inside of the Statistics Plugin.
Maybe one of these following links could be useful for you:
The end!